
The D.C. Policy Center report, “Taking Stock of the District’s Housing Stock: Capacity, Affordability and Pressures on Family Housing” provides a comprehensive picture of the District’s housing stock to explore a longer-term view of housing affordability, especially for low and middle-income families in the District of Columbia.
Taking Stock creates a new dataset of the District’s housing stock from multiple data sources. It uses this information to estimate the number of housing units in the city, the types of buildings that contain housing units, and the capacity of each unit. It also develops a methodology to estimate the potential affordability of each unit.
The report finds that a significant pressure on the District’s housing market is the fierce competition for larger units from affluent singles and couples. The District has many more larger units than families who could live in them; however, affluent singles and couples occupy many of these. Meanwhile, there are not enough smaller units to satisfy the demand from small households. Furthermore, land-use and zoning policies restrict the amount and mix of housing supply in many parts of the city with public and private amenities. Other parts of the city have affordable family-sized units but lack the resources families need to thrive. Both dynamics limit the city’s inclusiveness, amplifying gentrification, economic segregation, and the loss of low- and middle-income families.
Quick links
- Summary of the report and its key findings and conclusions can be found here.
- PDF of the full report here.
Chapter 1. Introduction
Housing policies are central to the inclusiveness of a city. Housing defines, in large part, how residents share the wealth created by a city and how they access its assets and amenities. Where we live deeply affects our quality of life and the opportunities available to us and our children, especially jobs and schools. How we invest in neighborhoods determines the desirability of the housing stock in those neighborhoods. How we regulate our housing market can shape who stays in the city and who leaves. Public policies that control the housing supply and public investments in amenities and services such as schools, transportation, and infrastructure can play roles as strong as private wealth in defining the demographic make-up of the city.1 Population growth and demographic changes play out through the housing market and, when the housing is constrained, these forces further amplify gentrification, economic segregation,2 and displacement.
Finding housing can be extremely difficult for low and middle-income households in the District of Columbia.3 A 2015 study by Governing Magazine found that 62 percent of housing units listed for sale in the District of Columbia were either too expensive or too small for a family of four at or below the area median income.4 The rental market is not much better for families, as only a quarter of available units have two bedrooms, and less than 2 percent have three bedrooms.5
Lack of housing options for low and middle-income households limits the District’s potential to become an inclusive city and closes the path of opportunity for many. High cost burden of housing pushes low and middle-income families out of the city.6 Compared to neighboring jurisdictions, the District has experienced a significant loss in low and middle-income households,7,8 and about half the people who move out of the city to the surrounding jurisdictions cite concern about housing and neighborhood quality as their reason.9 The exodus of low and middle-income families has increased economic segregation in the District of Columbia. While median incomes of families with children increased 30 percent or more in Wards 4, 5, and 6 between 2000 and 2016, the opposite happened in Wards 7 and 8, which saw declines of up to 10 percent in nominal incomes.10
Most District policy on affordable housing focuses on providing immediate and near-term support for burdened households. The District has a robust Housing Production Trust Fund which produced 11,000 affordable units between 2001 and 2015.11 The city also has strong tenant protection laws, an Inclusionary Zoning Program,12 rent controls, Tenant Opportunity Purchase Agreement (TOPA) laws13 that allow low-income residents an opportunity to buy units when an owner decides to sell a rental property, and a new fund14 that will support preservation of affordable units. The city also offers financial protections to low-income homeowners through various tax preferences (by capping real property tax increases, allowing for real property tax reductions and deferrals to seniors, disabled residents, and low-income households, and allowing residents with very low incomes to deduct from their income taxes a certain share of how much they spend on housing every year). Yet, these programs and policies aimed at producing and preserving affordable units have not been able to put a significant dent in escalating housing costs and burdens in the city.15
In the near-term, the actual occupancy of housing stock changes too slowly to make more room for low and middle-income households. So, providing financial support to produce and preserve low-cost dwellings makes sense. But an analysis of the District’s housing supply, which focuses on not what is currently available, but what could be available, both through preservation and new development, can help identify policies that will contribute to a stronger housing stock and a more inclusive city.
The primary motivation for this study is to explore a longer-term view of housing in the District to identify policy options that can foster inclusive growth. We take a comprehensive look at the District’s housing stock and examine every housing unit that was on the District’s real property tax rolls in December of 2017, including the types of housing units, the capacity of housing units and affordability of housing units, and how these vary across different neighborhoods of the city. We then compare the structure of the housing stock to the demographic profile of the city and identify points of pressure on family housing and look for policy options that can relieve those pressures.
To our knowledge, ours is the first study that looks at the District’s overall housing stock: what it looks like and how well it is equipped to support a diverse city with a growing population. We combine information from multiple data sources to characterize the housing stock. These include assessment data from the city’s real property tax rolls, data on the characteristics of housing units and buildings including living area, the number of rooms, size of units, quality of the buildings and their infrastructure, and the number of units in apartment buildings pulled from the city’s assessment database. We mapped this data using two spatial files that link each property on the tax rolls to a land parcel in the District. This information allows us to estimate the number of housing units and the capacity of these units (i.e. how many people can comfortably live in a unit), how these units are distributed across the city, how much they would be worth if they were on the market today, and who can afford them.
Understanding the characteristics of the housing stock in the District is important for several reasons. First, a better grasp of the characteristics of the housing stock can help identify the pressures on the city’s housing market and determine where, across what types of housing, and across what price range housing shortages are the most dire. Second, it can shed light on the extent to which current land use policies restrict growth of the housing inventory. Third, it puts in context whether under current market conditions and the policy structure the pipeline of new housing can change the housing stock significantly enough to solve affordability and scarcity problems. Finally, it can help identify ways in which the existing housing stock can be altered or repurposed to meet changing needs. In fact, new building activity accounts for a small share of residential construction activity relative to renovation and reconfiguration of the existing housing stock. Between 2008 and 2016, new construction accounted for only 4 percent of the permits issued. The bulk of the permit activity (over 80 per-cent) was for additions and alternations.16
This analysis is particularly timely. The District maintains a long-range policy document—the Comprehensive Plan—which sets the framework for the kinds of changes the city’s landscape could experience over a twenty-year period. The city is currently updating its Comprehensive Plan, and while the plan’s elements will not necessarily imply financial commitment from the city, they will have a significant impact on land use and zoning, set the tone for future policies, and determine the paths for future private investment in housing production. The Comprehensive Plan sparked an intense policy debate on whether modifying zoning to allow for the construction of more market rate housing can solve the problem or whether the city should regulate or subsidize the production of more affordable housing units. Our findings can inform this debate.17
The main takeaways from the study are the following:
First, repurposing of the existing stock has played a large role in responding to the growing demand in recent years. Over the last ten years, the growth in new housing in the District of Columbia has not kept pace with population growth. Between 2010 and 2016, the District’s resident population increased by 79,447 persons (13.2 percent) whereas its housing stock increased by 16,999 units or only about 5 percent. Housing production has increased in the last five years, but much of housing construction has taken the form of rehabilitating existing units. The new households also settled in previously vacant units or units altered to fit more households.
Second, the District has many large, family-sized units but many of them are occupied by one and two-person households. The District has 154,500 units that can comfortably accommodate up to two persons,18 and 207,800 housing units with one or two persons occupying them.19 There are many units that can hold families of three or more in D.C.—more than twice the number of families—but smaller households (young and affluent singles and couples and seniors) have spread into these units.
Third, the competition from affluent singles and young couples is a significant factor in the limited supply of middle-income family housing. Many couples and singles in the District are more affluent than many District families, and because they do not have children and the expenses related to children, the couples and singles can spare a larger share of their incomes on housing. There are 26,900 units appropriately-sized units (out of 303,905 units for which we can calculate capacity) affordable for a family of four earning between 80 percent and 120 percent of Median Area Income (approximately $90,000 to $130,000). There are 3,000 four-person households at this level of income in the District compared to 17,500 two-person households and 19,660 single-person households.
Fourth, the District has very few starter homes affordable to middle income families ( with an estimated value under $560,000 or affordable for a family with income at or below Area Median Income). We estimate that there are only 4,764 single-family homes (5,700 if one includes condominiums and cooperatives) that are between 1,500 and 1,800 square feet and have at least two bedrooms in this price range. We found only two in west of the Park neighborhoods.
Some neighborhoods with a high concentration of family-sized units have low home ownership rates. These units are affordable but either do not appear to have the amenities to encourage ownership, or high concentration of investor-owners who have little incentive sell their homes to families. Deanwood, for example, has 2,204 single family homes (47 percent of all single-family homes in the neighborhood) not occupied by owners, Congress Heights has 1,333 such units (41 percent), Randle Heights has 1,159 (42 percent) and Marshall Heights has 655 (51 percent). Almost all these units are affordable at under 100 percent of area median income, but do not entice ownership.
Some neighborhoods with desirable amenities have extremely limited potential for future development under current zoning laws. We counted nine neighborhoods west of the Rock Creek Park with only single-family homes, except for a modest number of coops and a single condominium building. Almost all these homes are expensive, affordable at or above 120 percent of Area Median Income for a family of four. In these neighborhoods, minor changes to the mix of housing can significantly increase the number of units, but zoning, in particular, stands in the way.
Two important implications follow from these findings.
First, any new unit that comes on the market that satisfies the demand from affluent singles and couples can increase affordability of family housing and help keep more low and middle-income families here. Studies elsewhere have shown this to be the case. For example, a study by the California State Legislative Analysis Office finds that California communities with the greatest expansion of market-rate housing also see the least low-income displacement.20 U.C. Berkley’s Karen Chapple and Miriam Zuk build on this analysis to show that a new market rate home has almost half as much impact on measured displacement as building a subsidized home.21 Our study suggests that these forces are also very strong in the District of Columbia.
Second, in a land-constrained city like the District of Columbia, the city should focus on making the most out of its undeveloped and underdeveloped land. Some neighborhoods in the Northeast and Southeast quadrants of the city have significant family housing stock that is affordable but lack the resources that these families would need to truly thrive. Lack of public and private investments in amenities desired by families such as good schools, safe streets, access to transportation, retail, and job centers provide little incentive for the investor-owners to improve or sell the units they currently use for rental income. The absence of these amenities also ill-serve the low-income District residents who live in these neighborhoods, reducing their quality of life, and limiting their livelihoods and the opportunities for their children. These exacerbate the racial and socioeconomic divides in our city. On the other hand, some neighborhoods in the Northwest quadrant of the city have tremendous amenities but lack the mix of housing that would make these neighborhoods inclusive and accessible to a wider range of incomes. Restrictive land use and zoning regulations have excluded these neighborhoods from the reach of low and middle-income families. These discrepancies between land use and demand are detrimental in limiting the supply of housing in the District. Investments in the form of better amenities in some neighborhoods and more capacity under zoning laws for increased development in others could dramatically increase the number of affordable units available to families.
Many factors need to come together to create policies that produce or enable market forces to produce affordable, desirable housing with access to public and private amenities. There is no easy solution, but policies that reconcile the supply and demand in the market economy with affordability will improve outcomes. In what follows, we first present a broad picture of the housing stock in the District of Columbia including the estimated number of units, the structure and location of residential buildings, the capacity of units in comparison to the District’s household structure, ownership characteristics, estimated valued, both for whole units and on a square feet basis, and who can potentially own these units. We then consider the attractiveness of the city to low and middle-income families and discuss potential policies that can help market forces create more inclusive and more affordable housing.
Chapter 2. Housing units, population, and prices
Housing prices have been rapidly increasing in the District of Columbia. Those who purchased a house in the city before 1995 are at least 4.5 times richer in their investment despite the dampening effect of the Great Recession, which caused the prices to collapse between 2007 and 2009. The price increases in the District have outperformed the 2.6-fold increase in the Washington Metropolitan area.
Figure 1 – Housing Price Index for the District and the Metropolitan Washington Area (1995=100)

High and rising prices in the District tell us that people value the city. They also signal that the District is not particularly good at meeting the increasing demand through producing new units. Just by comparing units to population, we see that the District’s production of new units has not been able to keep up.22 The District population added an estimated 9,636 net new residents in 2017—a 1.5 percent growth. We do not yet know the Census Bureau’s housing unit estimates for 2017, but data from previous years reveal that the resident population grew over two times faster than number of housing units. Between 2010 and 2016, the District’s resident population increased by 79,447 persons (13.2 percent), number of households23 increased by 28,853 (11.4 percent), but its housing stock increased only by 16,999 (5 percent).24 Occupied housing units increased faster at 19,229 or about 7 percent, and the ratio of population to housing units increased by about 6 percent, suggesting that the District is making better use of its existing housing units, and much of the change is coming from repurposing of the existing housing stock and reduction in vacancies. This is an important indicator of why discussions of affordability must also take into consideration, not just what is in the pipeline, but also what the housing stock looks like, where it is underused, and where it could be modified to accommodate more households.
Figure 2 – Change in Population, Housing Units, and Occupied Housing Units

Many of the District’s housing units are small. Census Data show that 40 percent of the housing units in the District are studios and one- bedrooms.25 That is an estimated 121,887 units. Our own count (we discuss the methodology in the Appendix) of units that can comfortably accommodate one or two persons is 154,580. Still, as we will show in the next chapter, even this is not enough to meet the demand from the smaller households with one or two persons. Because of the high concentration of smaller households that occupy both small and large units, the ratio of population to housing units is low in the District compared to our neighboring jurisdictions. In 2016, each housing unit in the District, on average, had 2.17 residents. In comparison, the units in Montgomery County had 2.67 residents, in Loudoun County 2.97 residents, and in Manassas Park City, a whopping 3.24 residents.
Figure 3 – Resident Population per Housing Unit, Counties of the Metropolitan Washington Area, 2016

The low housing unit-to-resident ratio is a function of the type of housing and households in the District. The city has many single and two-person households (207,800 of DC’s 281,000 occupied housing units have one or two persons living in them) and we have many (but not enough) small units serving this population.26 As a result, small households spread into larger units, sometimes just as sole occupiers. The District is not alone as a major city displaying this kind of phenomenon. The average persons per housing unit is also low in San Francisco, compared to its surrounding counties. Same happens, to a lesser extent, in Boston and New York City. In Manhattan (New York County), for example, there are 1.85 persons per household compared to the metro average of 2.7. But New York City is very dense with ninety percent of housing in buildings with 10 or more units and more than half of these units are studios or one-bedroom apartments. Because the District does not have enough small units, and its building density is low with single family homes taking much of the space, people tend to double up more often than they do in New York, increasing the average persons per unit.27
Chapter 3. What does the District’s housing stock look like?
We are interested in what the housing stock looks like and how well equipped it is to serve the growing number of families, especially middle-income families. Many characteristics of a house affect its value: its size, condition, location, and the appeal of its neighborhood. In this study, we focus on type, size, location, and affordability.
To better understand the characteristics of the District’s housing stock, we combined information from multiple sources. These include the city’s real property tax rolls and assessment databases that record data on the characteristics of housing units and buildings including living area, the number of rooms, quality of the buildings and their infrastructure, and the number of units in apartment buildings. This information allowed us to estimate the number and the capacity of housing units, how they are distributed across the city, and how much they could be worth if these units were on the market today. We mapped this data using two spatial files that link each property on the tax rolls to a land parcel in the District. The Methodology Section of this report describes the steps we took and the assumptions we made in estimating the number of units, market values, and affordability. This section also provides links to data sources, all of which are publicly available.
To our knowledge, ours is the first study to focus on the characteristics and affordability of the District’s housing stock using information from actual housing data, and not from survey estimates. This is important because by characterizing the housing stock—size of homes, their location, and who can theoretically afford them—we focus on how the District’s housing stock is actually used as well as what causes the demand pressures.
Figure 4 – Housing Units by Ownership and Use

Number and type of units
We estimate that there about 319,808 housing units in the District of Columbia spread across 117,916 buildings.28 But not all these units are available to residents. About 10 percent of the District’s housing stock is owned by foreign governments, the U.S. government, or are otherwise not available to residents because they are a part of educational, religious, or medical complexes. For example, the US government holds about 2,000 housing units in 125 buildings, and all other similarly exclusive use units add up to about 14,000. That means there are about 303,950 units available for residents spread around 116,700 buildings. In addition, the tax rolls show that there are 450 parcels under development.29
The 93,474 single-family units make up only 30 percent of the District’s housing stock, but 80 percent of the residential buildings. The rest of the housing stock is made up of 120,600 rental apartment units, 64,300 condominium units, and 25,600 units in cooperatives or conversions,30 all in crammed in 23,400 buildings. That is, the footprint of small, single, or double unit buildings in the District is extremely large, giving certain parts of the city a suburban feeling.31
Figure 5 – Housing Buildings and Units by Type

Capacity v. occupancy
We estimate that about 51 percent of the housing stock (154,580 units) can comfortably accommodate only one or two persons.32 Another 18 percent (53,700) can comfortably hold three persons, such as a new family with a single child and only 14,600 of these units are single family homes, the rest are condominiums and apartments, with just a couple thousand cooperatives added to the mix. 31 percent of the housing stock (95,600 housing units) can accommodate household of four or more, and 82 percent of these (78,360) are single family units, and only 8 percent (7,216 units) are in large rental apartments. The Methodology Section describes in detail how we developed these capacity estimates.
Figure 6 – The Estimated Capacity and Occupancy of Housing Units, by Size of Households

The comparison of the estimated capacity of the units to their occupancy shows a great discrepancy between household size and housing size in the District of Columbia. The estimated number of units designed specifically for one or two persons is 154,600. However, the number of housing units with one or two occupants, based on survey data, is 207,800. There is enough housing stock to hold households of three persons (53,700 units with a capacity to hold three persons compared to 34,000 units with 3 persons occupying the unit) and households of four and more persons (95,600 units compared to 39,380 such households). That is, the singles and doubles—some of them seniors—are occupying larger units, and the demand from them (especially demand from the more affluent ones) is increasing the cost of housing for families (especially less affluent ones).
This discrepancy between capacity and occupancy has important implications on how one thinks about affordability. First, it tells us that every market rate unit, to the extent that it can satisfy the demand from a smaller household, can help reduce prices across units of all sizes. To wit, the availability of middle-income housing units can benefit from a rapid increase in the supply of units sized for smaller households. A greater supply of smaller units on the market that can entice smaller households to move into these units can relieve some of the pressures on middle-income family housing. Second, it shows that families are competing with singles and couples for family-sized housing. Given the high concentration of small and affluent households in the District, this competition could be pushing families to look for housing options outside of the District. We return to this issue later, when we consider the affordability of the units.
Where are the housing units?
Over half of the housing units in the District (55 percent) are in the Northwest quadrant—not surprising given the sheer size of this quadrant. Neighborhoods in the Northwest quadrant hold 70 percent of all condominiums, coops, or conversions (rental apartment buildings that later converted their units into condominiums or coops), 50 percent of the apartments and 48 percent of single-family houses (including detached units, semidetached units, or row houses). The Northeast and Southeast quadrants hold 21 percent and 20 percent of housing units respectively with Northeast having more single-family units and Southeast more apartments. Only 4 percent of the housing stock is in the Southwest quadrant and only a handful of these units are single family homes. Southwest is very small compared to the other three quadrants. It also has vast quantities of land not available for residential use: the future home of the soccer stadium at Buzzard Point, the Blue Plains Water Treatment Facility, and Bolling Airforce Base are in Southwest, leaving only a modest amount of land between I-295 and South Capitol Street in addition to what is in the Southwest Waterfront for any other use.
Figure 7 – The Location of Housing Units by City Quadrant and Type of Structure

For a small city, the District has many neighborhoods comprised of single family units. That is, unit density across all residential buildings—at an average of 2.71 per building—is not particularly high. Across tax assessment neighborhoods,33 NoMa is the notable outlier with the average of 109.4 units per building. In NoMa, 98 percent of units are in buildings that have 125 or more units. Other neighborhoods with high building density are the Navy Yard (an average of 48.7 units building), followed by Central City (an average of 36.2 units), Foggy Bottom (19.3 units), and the Southwest Waterfront (16.1 units). On the other extreme, there are 23 neighborhoods where the number of housing units per building is under 2, and in eighteen neighborhoods along the Northeast and Northwest borders of the city, where this number is below 1.5.
Figure 8 – The Average Number of Housing Units Per Building In Each Assessment Neighborhood in the District

Across the District, we count only eleven assessment neighborhoods where there are more than five units per building, on average. In another fourteen neighborhoods, there are more than two units per building. In the remaining thirty-two assessment neighborhoods, a typical residential unit is either a single-family detached home, a semi-detached home, or a row house. For a land-constrained city like the District., that means a lot of land has been dedicated to low-rise, low-occupancy housing units.34 This structure of the housing stock is a creature of zoning and land use regulations. While in the Downtown area there are no major zoning restrictions, in the neighborhoods outside Downtown, most housing is still in low-rise buildings: a mixture of single family units and units converted to flats in small buildings. The notable exceptions to the low-density development outside of the Downtown area are in Southeast where multifamily units are the norm, especially in the neighborhoods of Congress Heights, Randle Heights, and Barry Farms. The same is true for Fort Dupont Park and Lily Ponds in Northeast. All of these are neighborhoods with low home ownership and low incomes. The map of housing units by broad category35 immediately highlights how much of the District’s land use is dedicated to single-family housing often with low occupancy. Almost the entirety of Ward 3’s land zoned for residential use is occupied by single-family units. It is the same through large swaths of Wards 2, 4, 5 and 7. Multifamily units are concentrated in the Downtown area, and also occupy a majority of the residential buildings in Ward 8.36
Figure 9 – Map of Housing Units in the District of Columbia By the Type of Building Structure
Source: Data compiled by the D.C. Policy Center
This mix of the housing structures that favors single-family units in the District is a major factor of exclusion. Even small changes in the mix of buildings can make meaningful improvements to the inclusiveness of the city.37 Consider the eight assessment neighborhoods in Northwest (Hawthorne, Colonial Village, Woodley, Foxhall, Burleith, Kent, Spring Valley and Berkley) with an average of one unit per building—all single-family homes. These eight neighborhoods, collectively, have 4,876 housing units in 4,748 buildings. Adding a single low-rise multifamily building with 100 units in each of these neighborhoods would increase their housing units by 16 percent while increasing the number of buildings by 0.2 percent. However, current zoning does not allow even such a modest expansion. That is, potentially 800 families that could have been benefiting from the amenities offered by these attractive neighborhoods – good schools, safe streets, access to employment centers—excluded from the city.
Ownership
About one third of housing units in the District (about 103,200 units) are owner-occupied. Owner-occupied units are less likely to have turnover, and more likely to contribute to the stability of neighborhoods. Home ownership has historically been a factor in whether families are able to accumulate wealth and pass that wealth down between generations, and historical inequities in home ownership have contributed to modern-day disparities in wealth accumulation.38
Figure 10 – Owner-Occupied Housing and Its Distribution Across the District Assessment Neighborhoods and Quadrants

The neighborhoods with the lowest homeownership rates in the District are the Southwest quadrant. Here, renters occupy 82 percent of the housing units. The neighborhood with the highest share of homes occupied by owners is Hawthorne, a small tax assessment neighborhood nested between Chevy Chase and Rock Creek Park. 275 out of 309 housing units in this neighborhood are occupied by their owners. By contrast, around the Navy Yard and the Ballpark area, only 2.5 percent of all units are owner-occupied. Given that most housing there is in rental buildings, this is not surprising.
Figure 11 – Housing units by owner-occupied v. renter occupied status
Source: Data compiled by the D.C. Policy Center
The share of owner-occupied housing is highest in the Northeast quadrant, at 38 percent, and especially high among seniors. Concentrated home ownership in the long-standing residential neighborhoods of Hillcrest and the northeast section of Capitol Hill, both of which have about 80 percent of housing units occupied by their owners, ramp the average up across the Northeast quadrant. However, the neighborhoods in this quadrant are the most diverse in terms of renter v. owner-occupied units. In the NoMa tax assessment neighborhood, virtually no homes are owner-occupied. This quadrant also includes some of the most rapidly gentrifying parts of the city with the fastest increasing home valuations (Brentwood, Edgewood, Ivy City, Trinidad), and where resistance to new development could become very fierce, as has been with the plan for the McMillan Sand Treatment Plant.
Neighborhoods in the Northwest quadrant have 34 percent of all housing units occupied by their owners, but this is due to the low homeownership rates across the densely populated Foggy Bottom and the Central assessment neighborhood, which offer many rental options. If one measures ownership across the assessment neighborhood level, one finds a median of 50 percent owner-occupied housing. The variation in home ownership across neighborhoods is also large in this quadrant, with neighborhoods west of the Park having over 70 percent owner-occupied housing (Colonial Village, Hawthorn, Woodley, Kent, Spring Valley, American University Park), and under 20 percent in Foggy Bottom and Central assessment neighborhoods.
The map of units by the ownership status of their occupants shows that the neighborhoods along the northeast and northwest borders of the city are particularly strong in homeownership. The Hillcrest neighborhood in Ward 7 also stands out, especially in the preponderance of senior-owned housing. This is also true for Michigan Park, Riggs Park, Woodridge, and parts of Brookland in Ward 5.39 Deanwood has a large proportion of single-family units but much of these units are not owner-occupied.
Tax implications of homeownership
The District has adopted policies that provide a favorable tax treatment of homes occupied by their owners. Homeowners who live in their property are exempted from real property taxes on the first $72,450 of the home’s assessed value.40 In addition, senior citizens and certain disabled persons who occupy their own homes can receive a 50 percent discount on their real property tax bills. The District also caps the amount by which taxes can go up each year to protect homeowners from wild swings in property values. One’s taxable assessment—and therefore tax bill—cannot go up by more than 10 percent even if the home’s assessment increases by more than 10 percent.41
The combination of the homestead exemption and the property tax cap reduces the District’s effective taxable real property value by 25 percent across all eligible properties. At present, the statutory rate in the District is 85 cents per $100 of assessed value. The effective tax rate on houses is actually closer to 64 cents.42 This does not include the impact of the senior tax credit, which further cuts the rate down by half, to about 32 cents per $100 of assessed value for properties owned by qualified seniors.
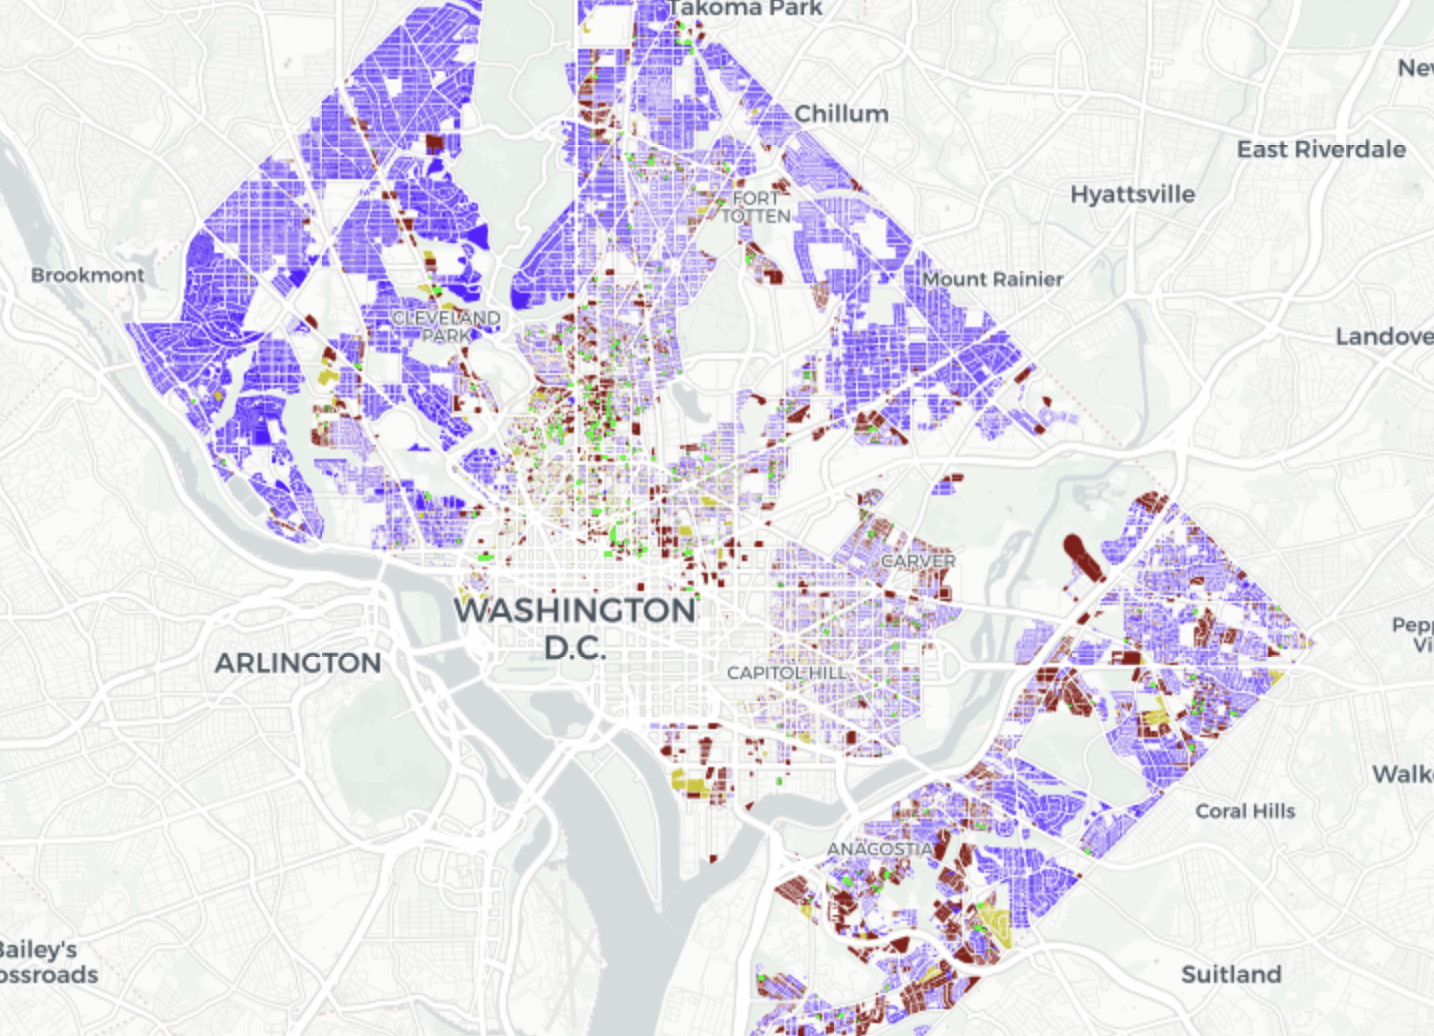
Figure 12 – The Impact of Homestead Exemption and Real Property Tax Cap On Taxable Assessments in the District

See the interactive version here.
Figure 12 maps the impact of the property tax policies on taxable assessments. The cooler purple colors show units where taxable assessments are closest to market assessments. And these are areas with high housing values. The warm gold colors show where the property tax policies have the greatest relative impact. This map shows that the District’s tax policy for owner-occupied housing provides larger benefits to owners of lower priced houses and to those who have owned their homes longer. As a result, the impact of the tax preferences is greatest in neighborhoods east of the river. For example, across the 2,400 homestead properties in Congress Heights, where the average market assessment is $219,000, taxable assessments are only 54 percent of market assessments. Compare this to Capitol Hill, where average market assessment is around $900,000, the tax breaks reduce taxable assessments to 82 percent of market assessments. But homeowners throughout the city derive some benefit. Even in Massachusetts Avenue Heights, the little neighborhood of about 130 single family homes that lies northeast of the Naval Observatory, with its average assessed values of over $2.8 million, residents still get a 6 percent reduction on their taxable assessments.43
Estimated value per square foot
Across 303,900 housing units available for resident use in the District, the estimated median value is $459 per square foot. If we exclude from this group D.C. Government-owned affordable housing units (6,500 units), and units that are tax exempt44 because they serve low income families (1,098 units), we see the median income assessment increases to $460 per square foot—a value comparable to what real estate analysts have found.45 The methodology used for estimating the per square foot value is explained in the Appendix.
Figure 13 – The Estimated Market Value per Square Foot, By the Type of Building Structure

In Figure 13, every dot represents a single property.46 We group these by structure type and order them by our estimated market value per square foot. For each group, we display the assessed value at the 5th percentile (the bottom number), the median assessed value (middle number) and the assessed value at the 95th percentile (top number).
Here are some notable aspects of the per square foot valuations across different types of units:
- Condominium units and units in cooperatives are the highest valued housing units on a per square foot basis. The estimated median value for condominiums is $562 per square foot and for cooperatives it is $513 per square foot. These units are more likely to be in highly desirable neighborhoods and therefore more expensive. For example, 73 percent of condominium units and 65 percent of cooperatives are in the Northwest quadrant. The values also reflect professional building management shared amenities such as a concierge, rigorous building maintenance, and shared amenities in common areas.
- Single family homes have lower estimated values on a per square foot basis. They also have the least amount of variation in valuations based on our estimates. The median value of single family homes is $396 per square foot. Row houses are most expensive and semi-detached housing units (clustered in the Northeast and Southeast quadrants) are the least expensive. And the distribution of values among single family units is also tight with 80 percent of single family homes with an estimated value between $200 and $500 per square foot.
- Rentals can have low estimated values, but the variation in valuations are great under our estimation methodology. Rental apartments have the lowest median estimated value per square foot at $241, but that is because they are found all around the city. They also include subsidized and rent-controlled units. We estimate a median per square foot value of $549 for rental units in the Northwest quadrant, at par with coops and condominiums. In the Southeast quadrant, the median value for rental units is $275. Only about 10 percent of units in the Northwest quadrant have estimated values at this level. Only 47 percent of rental units fall between $200 and $500 per square foot in value compared to 61 percent of cooperative units, and 51 percent of condominiums
- Estimated values increase from east to west, with some unexpected pockets of affordability. East of the river, median assessments are under $234 per square foot across assessment neighborhoods, with lowest values in Congress Heights ($192) and highest in Hillcrest.47 West of the Anacostia River, Fort Lincoln is the only neighborhood with a median assessed value under $250 per square foot. Moving farther west, the lowest estimated median values we find are all over $330 per square foot with Chillum, Takoma, and Brightwood offering the best bargains. West of the Park, it is not unusual to see median values over $500 per square foot. The only West of the Park neighborhood with a median value under $450 is Wesley Heights ($437 per square foot), which includes many senior owned properties.
- Median estimated value across all east of the river communities is $216 per square foot. That is, a starter home of 1,800 sq. ft. will cost $388,800; making it affordable to a household income of $77,760 or 71 percent of median area income.48 But this calculation assumes such a unit is available. Crossing the river adds at least $55 per square foot, and often, much more.
- Housing owned by seniors have lower estimated values. The median per square foot value for senior-owned and occupied units is $353, compared to $477 for non-senior homestead properties, and $480 per square foot for properties not occupied by their owners. Some of the price differentials have to do with the location of these homes: Senior-owned and occupied homes are concentrated in Brookland, Petworth, Brightwood, and the Old City (a large assessment neighborhood that looks like a giant question mark surrounding Capitol Hill, beginning with Union Station, and the tail ending at Buzzard Point), but their relative share is greatest in Riggs Park (28 percent), Michigan Park (29 percent), Colonial Village (21 percent), Hawthorn (19 percent), Woodridge (19 percent), and Chillum (17 percent).
Next is the map of estimated value per square foot for all the properties we could map. The pockets of lower valued units west of the Park, along Connecticut Avenue are rent controlled units and cooperatives.
Figure 14 – The Map of District Housing Units by the Estimated Market Value Per Square Foot
Source: Data compiled by the D.C. Policy Center
Chapter 4. Where are the housing units affordable for middle-income families in the District?
The per square foot valuation is useful in standardizing value but having the right valuation on a square foot of housing does not mean that the housing itself is suitable for the needs of its potential occupant. One could afford $350 per square foot but may not be able to find the type of housing they desire in a certain neighborhood. In this section, we turn to the actual housing stock and consider the number of units potentially affordable to low and middle-income households and where those units might be found. We estimate the annual cost of each housing unit by multiplying its estimated value with a “capitalization rate,” the rate of return for real estate to determine how much a piece of property could bring to its owner each year, and therefore how much one would spend to live in this unit. Our Methodology Section in the Appendix provides a detailed explanation of our approach and our reasoning. We then calculated the annual income one must earn to keep this annual cost under 30 percent of household income—a commonly standard of affordability.49 We repeated these steps separately for units in different types of structures, location and of different sizes and capacities—the number of people who can comfortably live in the house—since cap rates vary by location and structure type, and incomes and appropriateness of units are functions of the size of the household.
Single-family starter homes
We began this exercise considering single-family homes between 1,500 and 1,800 sq. ft. that could accommodate a family of four (at least 2 bedrooms). The chart below shows the per square foot valuation of every single-family home between 1,500 and 1,800 square feet with at least two bedrooms and is affordable for a family of four with $110,300 of annual income, which is the area median income (a housing unit that cannot be more expensive than $560,000).50
We found that of the 16,900 single family homes that fit our size and number of rooms criteria, only 4,764 properties (28 percent) could be potentially affordable to a family making the median income.51 Three-quarters of these units are in the Northeast and Southeast quadrants. In all seven neighborhoods—Brightwood, Brookland, Petworth, Woodridge, Congress Heights, Deanwood, and Hillcrest hold, again, 75 percent of these homes. We could find only 2 such homes west of the Park (out of 3,101 starter homes), none on Capitol Hill (out of 431), just 3 in Shepherd Park (out of 232 starter homes), and 57 (out of 1952) in the very large Old City I assessment neighborhood that has more starter homes than any other neighborhood assessment area.
Figure 15 – Starter Homes Affordable At 100 Percent Of Area Median Income or Less for a Family of Four

The numbers rapidly get worse at lower income levels. At 80 percent of AMI, we could find only 1,821 starter homes in the District’s housing stock of 303,900 units that are potentially affordable for middle-income families. At 60 percent, we could find only 533 such starter homes. To put this in context, the American Community Survey data tell us that of the 121,101 families in the District of Columbia, about 70,000 families have incomes under $110,000,52 51,000 families make less than 80 percent of area median income, and about 41,500 families make 60 percent of area median income or less.
Potential affordability across all units
The chart below shows the number of housing units in the District’s current housing stock that are potentially available and affordable for households of different sizes. Single person households can potentially live in all units—from tiny studios to large mansions—so long as they can afford them. Based on the values we estimate from tax assessments, we find that for the singles in the city (an estimated 131,000 households), there are about 8,200 units that are could potentially be affordable for those who earn under 30 percent of AMI (only 2.7 percent of the housing stock), 23,800 un ts potentially affordable to those who earn 30 to 50 percent of AMI (7.8 percent of the housing stock), and about 65,000 units potentially affordable to those who earn between 50 and 80 percent of the AMI (about 36 percent). That is, out of the District’s 303,900 housing units, 97,000 units are estimated to have values that could make them affordable for singles who earn under 80 percent of AMI—the cut-off AMI level for the District’s affordable housing programs. Hence, at least by our estimates, there are plenty of units that single-person households in the District could potentially live in. There are about 68,000 units that middle-income singles can potentially afford, but many of these units are big relative to the needs of a single person. And about 45 percent of the District’s housing stock is potentially too expensive for singles. But as we will show later, there are many affluent singles in the District that could compete for these units.
Figure 16 – Number and Affordability Distribution of Housing Units in the District for Households of Different Sizes
For two-person households,53 only about 220,000 out of the 303,900 housing units in the District’s housing stock are suitable (excluding super small units and studios). There are 4,800 units that could comfortably hold 2 persons and potentially affordable at 30 percent of AMI or less. This is 1.6 percent of the entire housing stock, or about 2.2 percent of the housing stock suitable for doubles. There are 65,800 units, altogether, that could be affordable to those who earn 80 percent of AMI or less (21 percent of the entire housing stock). A quarter of the housing stock that can hold two persons comfortably (50,900 units, or 17 percent of the entire housing stock, regardless of size) are potentially affordable for middle-income couples earning between 80 percent and 120 percent of AMI.
Beyond singles and doubles, appropriately-sized housing units decline rapidly, but there are still more units than households. For a family of three, slightly under 40,000 out of 149,300 units (13.2 percent of all housing stock) are potentially affordable at 80 percent of AMI or less, and 40,700 units that can be afforded by the middle-income households. And for a family of four, there are only about 95,600 suitable units that can comfortably hold four or more persons, and out of these, only about 25,000 (8.2 percent of all housing stock) are affordable at 80 percent of AMI and less, and 26,900 (8.9 percent) affordable for middle income families. A family with three children must pick from a shallow bench of 33,000 units, and if they earn less than 80 percent of AMI, their choices are limited to 13,700 units (less than 5 percent of the entire housing stock in D.C.).
Middle income housing for families and competition from smaller households
What are the potentially affordable options for a middle-income family of four in the District’s housing stock and where are these options located? We have noted that there are only 26,900 units large enough to hold a family of four that are potentially affordable at the 80 to 120 percent of AMI level and 52,000 units that are potentially affordable at or under 120 percent of AMI. For those looking for a neighborhood where most housing units are middle-income (affordable at 80 percent to 120 percent of AMI), the choices are limited to a handful of neighborhoods east of 16th Street and west of the Anacostia River, beginning at the District’s northeast border down to Massachusetts Avenue, and following the question-mark shaped Old City II tax assessment neighborhood. Top of the list is Petworth where we identified 4,125 units, or 79 percent of units that can accommodate 4 or more persons with estimated values within reach of middle-income families. In Brightwood, there are 2,505 units or 64 percent of similarly-sized housing stock, and in Brookland there are 2,670 units or 54 percent of the entire housing stock. Colombia Heights has 2,355 units or half its stock.
Smaller neighborhoods include Michigan Park with 700 units, or 72 percent of its stock, Woodridge, with 1,200 units within a couple blocks of Rhode Island Avenue, NE, constituting 54 percent of its stock, Eckington with 750 units, a little under half its stock, and Trinidad with 1,000 units or 65 percent of its stock. Old City II—a large assessment neighborhood which surrounds Capitol Hill, has 3,015 units, but these homes constitute only 35 percent of its similarly-sized housing stock. Almost all middle-income housing in these neighborhoods is single-family homes. Foggy Bottom has about 800 units, and Forest Hill, west of the Park, has about 600, nearly all apartments in rent-controlled buildings. Hillcrest has the highest share of middle-income housing east of the river, with about 900 units, and at 41 percent of its stock. Everywhere else, the share of middle income housing is under 15 percent (and a paltry 5 percent in Congress Heights and Fort Dupont Park). West of the Park, Observatory Circle and Forest Hill have the highest shares (still under half), but a combined unit count of 1,000. We count only 2 middle-income homes in Colonial Heights, and only 22 in the family-oriented Capitol Hill assessment neighborhood.
If we expand the neighborhoods to include all housing units potentially affordable at or below 120 percent of income, we see a shift to east of the river communities. Deanwood becomes the third biggest neighborhood with an affordable stock, offering 3,742 units, Hillcrest’s stock triples to 2,067 units, and Randle Heights, Fort Dupont Park, and Congress Heights also become important sources of housing with 2,204, 2,548, and 2,763 units respectively.
Figure 17 – The Distribution of Potentially Affordable Housing Units for Middle-Income Family Households in the District

Source: Data compiled by the D.C. Policy Center
Competition from singles and couples
The District has many affluent singles who compete for housing units along with larger households and can bid up the prices on larger family units. The median income of households with two persons in the past 12-months (adjusted for inflation) was $104,831. This is 1.2 times the AMI for similarly sized households, equivalent to the median income among households with four persons, and higher than the median incomes for households with five or more persons. According to the five-year data summary for the 2012-2016 period, there were 41,000 housing units occupied with two persons where the household income was greater than $104,000. While the District median income for singles, at $50,526, in 2016, was lower than the AMI (at $76,100), the distribution has long tails with 24,440 single person households making $104,000 or more.
Furthermore, at every income level, there are more single and two-person households compared to households with three or more people. This is a function of the city’s demographics. For example, among those who earn within 80 to 120 percent of Area Median Income (for a household of three or more) single and two-person households outsize households of three or more persons by 20,000. These smaller households, if they do not include a child and do not have to incur the expenses related to having children, can spend a larger part of their incomes on household costs, creating formidable competition for housing.
Figure 18 – Median Household Income in the Past 12 Months (in 2016 Inflation-Adjusted Dollars) by Household Size

Of the 27,000 units in the District’s housing stock that are potentially affordable to middle-income households with four persons, 12,781 are also within the reach of couples earning 80 percent and 120 percent of AMI, and 14,161 are potentially affordable to couples that make 150 percent of AMI. To put this in perspective, the estimated number of two-person households that make over 150 percent of AMI in the District of Columbia is 32,194. Only 3,062 of these 27,000 units are potentially affordable for singles who earn 80 to 120 percent of AMI, but nearly half could be affordable to singles who earn 120 percent to 150 percent of AMI. Even among the higher-valued units, competition from single-person households could be formidable. We estimate that 9,000 family-sized units that could be affordable to middle-income families can also be viable options for singles who earn above 150 percent of AMI for singles. In 2016, an estimated 30,300 of the District’s 120,000 single-person households earned incomes that would qualify them to live in these units.
The next figure breaks down this information by tax assessment neighborhoods with at least 400 middle-income housing units and shows how affordable these units are for smaller households. In Petworth, for example, 1,094 units are potentially affordable for singles who earn 150 percent or more of AMI for singles, and half the family units (2,061) could have been an easy lift for couples who earn 120 to 150 percent of AMI for couples. Competition from lower-income singles and couples is particularly strong in Brookland, Brightwood, Woodridge, Trinidad, and Hillcrest. Every unit in Foggy Bottom families could potentially choose to live face competition from singles and couples as well.
Figure 19 – Potentially Affordability of Middle-Income Family Housing Units in the District’s Housing Stock for Singles and Couples, by Neighborhood

The map of middle-income units that face the least competition from affluent couples explains why families live where they live in the city. Once we remove from the map units affordable to couples who earn 140 percent of AMI or less for a two-person household, we are left with neighborhoods to which families have been gravitating. We see heavy concentrations of units in Shepherd Park north of Walter Reed, Brightwood, Petworth, north of Colombia Road in Colombia Heights, in Kingman Park and Hill East. This is not to say that finding middle-income family housing in these neighborhoods is easy. But it is easier if a family limits its choices to neighborhoods where competition from singles and couples is least fierce.
Figure 20 – Middle-Income Family Units with the Least Potential Competition from Affluent Couples

The least and the most affordable family units
The geographic distribution of the most and the least affordable housing units in the District highlights the degree of economic segregation in the city. Based on our methodology, we found about 4,800 units which require a family of four to have an annual income of $276,000 or more—that is 2.5 times the area median income. This is 1.6 percent of the entire housing stock in the District. Except for Capitol Hill, these houses are concentrated west of the Park, and especially south of Massachusetts Avenue, and located nowhere near the most affordable homes (we count 4,600 units affordable at 50 percent of AMI, or the equivalent of annual income of $55,000 for a family of four).
Figure 21 – Family Units that are the Least and the Most Affordable in the District

Virtually all units most affordable to low-income families are in east of the Anacostia River. The following is a point often made but is worth repeating: High and low-income residents in the city live far away from each other. Residents in these disparate neighborhoods share very little in their day-to-day lives: not the schools, the bus lines, or the libraries; not the restaurants, the supermarkets, or the gas stations. This, combined with the extreme income inequality between black and white residents in D.C., further compounds the city’s segregation by race, and continues future racial inequities.54
To be sure, tax assessments drive our valuation estimates, and not necessarily what a house would sell for had it been on the market. But the income make-up of the District’s households does suggest that a startling number of homes are occupied by households with incomes over $280,000: the District has 17,643, households that earn this level of income, and over half of them are singles and couples. And if we exclude households that have no or negative income, we still find 93,000 households with incomes under $50,000; 12,000 of them are households with four or more persons. As many others have pointed out, housing costs burden the finances of many family households because they live in units that cost more than 30 percent of their incomes.
Chapter 5. Conclusions and recommendations
Housing is a very difficult issue in the District of Columbia, shaped by changing demographics, market forces, historic practices, government policies, and the beliefs, aspirations, and frustrations of residents. There is intense debate on what kind of housing policies are needed to address the District’s affordability problems. Broadly speaking, proponents of growth argue that increasing housing supply is essential. Again, broadly speaking, low-income housing advocates push for efforts to pay via taxes or require via regulations that more units be built specifically for low-income households. At present, a real area of disagreement is whether relaxing zoning limits to encourage the building of market rate housing can help solve, in part, the problem or whether it is better for the city to regulate or subsidize more affordable housing units into existence.
An examination of the District’s housing stock, including the type and capacity of units, their location, and affordability point to three findings. First, competition for family-sized housing units from affluent single and two-person households is an overlooked but an important factor in limiting the supply of low and middle-income family housing. The District’s housing stock has many small units, but even more small households. The housing stock has 154,600 units that can comfortably hold one or two persons, but such small households occupy 207,000 housing units, spreading out to larger, family-sized units. This is not just because there are not enough small units; smaller households also value the extra space or the neighborhoods with family-sized housing, and they are affluent enough to pay for it. In addition, many seniors who occupy family-sized units are unable or unwilling to downsize. Sometimes they cannot move to a smaller house and remain in their communities. Other times, smaller units are too expensive. These factors shape the market forces that squeeze low and middle-income families out of the housing market.
Some neighborhoods in the city have a high concentration of affordable family-sized units, but lack the resources families need to thrive, while some neighborhoods with desirable amenities have extremely limited potential for future development under current zoning laws. Deanwood, for example, has 4,500 family-sized homes, Congress Heights has 2,900 units, Randle Heights has 2,500 units, and Marshall Heights has 1,200 units, almost all affordable at or under 100 percent of area median income. These neighborhoods appear to be affordable, but the homes here are not able to compete with other family units in the rest of the city (or surrounding counties) when it comes to meeting the needs of middle-income families. Across these neighborhoods, less than 50 percent of single family homes are occupied by their owners. Further, most of the residents in these neighborhoods are low-income, many rely on Section 8 vouchers or other subsidies, and have few housing options elsewhere the city. In contrast, we came across nine neighborhoods west of the Park with over 90 percent home ownership, but only single-family homes, except for a modest number of coops and a single condominium building that would allow a price mix. Almost all these homes are expensive, affordable only for those who earn above 120 percent of Area Median Income for a family of four.
Third, the least and most affordable family-sized housing units are clustered in neighborhoods that are completely segregated and far away from each other. Units affordable for families making 50 percent of Area Median Income are all east of the River. Units that are only within the reach of families that make 2.5 times the Area Median income are, except for Capitol Hill, concentrated west of the Park, especially south of Massachusetts Avenue. High and low-income residents in the city live far away from each other. Residents in these disparate neighborhoods share very little in their day-to-day lives: Not the schools, the bus lines, or the libraries; not the restaurants, the supermarkets, or the gas stations. In the District of Columbia, segregation by income shares many characteristics of segregation by race.
Two important implications follow from these findings. First, any unit that comes on the market that can satisfy the demand from affluent singles and couples can have a significant impact on the availability and affordability of housing for all. Second, in a land-constrained city like the District of Columbia, the city should focus on making the most out of its existing land. Some neighborhoods in the Northeast and Southeast quadrants of the city have significant housing stock that is affordable but does not appear to be attractive to families. Lack of public and private investments in amenities that are necessary for families to thrive such as good schools, safe streets, access to transportation, retail, and employment centers reduces the attractiveness of the homes in these neighborhoods. The absence of these amenities also ill-serve the low-income District residents who live in these neighborhoods, reducing their quality of life, and limiting their livelihood and opportunities for their children, contributing to increasing segregation in the city. On the other hand, some neighborhoods in the Northwest quadrant of the city have tremendous amenities but lack the mix of housing that would make these neighborhoods inclusive and accessible to a wider range of incomes. Restrictive land use and zoning regulations have excluded these neighborhoods from the reach of low and middle-income families. These discrepancies between land use and demand are as detrimental, if not more so than the Height Act in limiting the supply of housing in the District. Taken together, investments in the form of better amenities in some neighborhoods and more room under zoning laws for increased development in others make a meaningful difference in the availability of housing for low and middle-income families.
Much of the housing that exists is because developers bought the land and built the housing they thought they could sell or rent. The forces of supply and demand determine the stock, and prices and rents within the current regulatory framework. That smaller households occupy larger units is not necessarily a mismatch, but more a realization of what people want, what in the housing stock they can choose from, and what they can pay for. Preferences of residents play an important role: Smaller households are sometimes attracted to larger units because they value the additional space, and the drawn to the neighborhoods where these homes are located. For many, the District’s single-family neighborhoods are convenient, close to amenities, and therefore attractive. And the District attracts affluent singles and couples who can pay for these units. For seniors, staying in their current large house can sometimes be the only feasible option. These forces will not change quickly, and certainly not in the absence of alternatives that can otherwise meet the demands or needs of smaller households.
The District’s history, especially in the context of national housing policies, also contributed to the current stock and the distribution of the city’s residents across the current stock. Northeast and Southeast quadrants of the city are mostly black and low-income in part owing to federal and District housing policies. Urban renewal wiped out almost all of Southwest’s buildings, forced out fifteen thousand businesses, and displaced twenty-three thousand residents, 70 percent of who were Black and 90 percent poor.55 Despite earlier promises that nobody would be displaced, the 5,800 new units built there were too few and far too expensive for Southwest’s original residents. As a result, most inhabitants of Southwest neighborhoods flocked elsewhere in the city, especially to Southeast (46.5 percent) and Northeast (25.1 percent). Beginning in 1950s, zoning changes reserved 75 percent of residential land in the farthest corners of the Southeast quadrant for rental apartment buildings—a policy with implications lasting to today.56 Black residents had no good housing options: federal housing programs from 1950s such as FHA and VA loans and the GI Bill were closed to them. Restrictive covenants, though legally unenforceable since 1947, were still in practice, with blacks paying twice as much for housing compared to whites and living in five times more crowded units. The city did not have any representative government, and this made the problem worse. Blacks did not have representation on the city’s boards or commissions, federal government representatives did not listen to the District’s black residents, and oftentimes acted to frustrate the best interests of the District.
The District, like many other cities, has adopted policies to encourage housing production, preserve neighborhoods, and increase affordability. These policies include building codes for safety, taxation to raise money for services, zoning to preserve neighborhood character, and much later, anti-discrimination laws. To deal with affordability, there is rent control, public housing, participation in federal programs (such as FHA loans and Section 8 rental assistance), Housing Production Trust Fund, DOPA and TOPA laws, Inclusionary Zoning requirements, and preservation efforts. There is homeowner and elderly exemptions from taxes, a “circuit breaker” program that allows low-income taxpayers to deduct from their income taxes part of their housing costs, and tax deferral for seniors who are struggling to pay property taxes. Particularly around Metro stops, the city has encouraged mixed-used developments with larger apartment houses, mostly with small units. That these policies have been adopted does not mean they been successful in accomplishing their stated objectives or are free of unintended consequences.57 But this patchwork of policies is what the current political system could muster.
There is no easy solution, but policies that reconcile the supply and demand in the market economy with affordability will help. Many factors need to come together to create policies that can produce or enable market forces to produce affordable, desirable housing with access to public and private amenities. The analysis presented in this study suggests that constructing more housing, especially housing that would be appealing to affluent singles and couples or seniors, is necessary to relieve some of the pressures on the housing market. It also suggests rethinking how we repurpose the existing stock and use the District’s land and public resources to create more inclusive communities with investments in neighborhoods to build better schools, better transportation networks that meet the needs of the residents, and achieve higher density to create a better business climate that can attract businesses and amenities to all parts of the city.
To be sure, many residents fear such changes. Some worry that once their neighborhoods become more desirable, gentrification will displace the lower-income residents who currently live there. They worry that the units that now serve the very-low income households will disappear, pushing these residents out of the city. Others, who want to preserve the look and feel of their neighborhoods, worry that new development would dilute the housing values. Understanding where our housing stock falls short of meeting the demand is important in shifting the conversation to finding ways to increase access, affordability, and inclusivity.
One important factor in reconciling the desire to have affordability with market forces is to consider what the city will look like in the future under current policies (given projections about population growth and economic conditions) and whether that future is a desirable one. One study estimates that the District will have to add over 105,000 units over a thirty-year period (beginning in 2012) to meet the demand of its growing population.58 That is an estimated 5,262 units each year.59 To the extent that the District will remain attractive to newcomers, without concurrent adequate growth in housing units, more residents will be displaced from their neighborhoods and more future residents will be excluded. Furthermore, these forces will play out in the context of the entire metro region, pushing young families or low-income residents to the outer suburbs of the metropolitan area where housing remains more affordable. Such trends will force the District’s workforce further away, increasing the time and money costs of commuting.60 And increasing housing costs will exhaust the economic wealth the District creates at the expense of growth.61,62
Another factor is what an inclusive city could (or should look) like and how market forces and government programs can be combined to help the city get there. Inclusivity could mean many things: mixing incomes, mixing households of all sizes, or having residents of all ages and all races and ethnicities, or a combination of these. But beyond that, the term remains under-defined because it is extremely hard to build an infallible vision around a more granular or neighborhood-level view of inclusivity. The District has a long history of segregated neighborhoods, by both income and race, and recent demographic and economic growth has not reversed this type of segregation. In fact, concentrated poverty and segregation has increased. The city’s housing policies—both historical and current—have contributed to this outcome. For example, the District’s subsidized housing tends to congregate in lower income neighborhoods63 because of high land costs or unavailability of buildable land elsewhere. Investments in public transit and transit corridors are uneven across the city, and sometimes not accompanied by sufficient increases in density to support growing demand, creating islands of gentrification. Market forces that would increase the mix of incomes and household types would have to rely on the ability to build such mixed-income housing through more permissive land use and the making of inclusivity a higher priority in new development. So far, the new neighborhoods in the District are not necessarily mixed: NoMa, which developed after 2000 is rather uniform in the type of housing it offers and the income necessary to live there. Large-scale redevelopments such as the former Walter Reed Hospital site, Saint Elizabeth’s East Campus, and part of the McMillan Reservoir site include significant mix-use and affordable housing components. Other potential redevelopment efforts on unbuilt land—such as the RFK stadium site, Old Soldiers’ Home, or Poplar Point can dramatically boost housing, but sometimes federal restrictions on land use, as in the case of RFK stadium make it extremely difficult.
Related to inclusiveness is the regional view, an important but often-ignored factor in housing. The District holds 10 percent of the population of the larger metropolitan area, which is the true economic unit with a single labor market, a single workforce, and an intertwined customer base, including for housing. Residents continuously weigh housing options across the entire metropolitan area, trading longer commutes for more expensive housing, which result in shifting demographic patterns. Therefore, housing policies adopted by the different jurisdictions in the metropolitan area shape a single housing market. But despite this interdependency, and the presence of several organizations that bring people together to discuss regional issues, there is little collaboration across the jurisdictions—even though jurisdictions across the region have deployed tools very similar to the ones the District has adopted to increase affordable units.64 In this fragmented policy environment, the supply of different types of housing shift to where it is financially feasible to build, sometimes pushing workforce too far away from employment centers. For example, new housing construction is no longer concentrated in the inner suburbs such as Fairfax, Montgomery, and Prince George’s Counties, but has shifted either to distant suburbs, which has become the destination for young families, or the inner core, which has become the destination of singles.65
Employer engagement in housing issues in the District of Columbia is limited but can play a large role in coordinating regional efforts. Workforce housing—housing for middle-income families who are not otherwise eligible for government support or subsidies66—is a real concern as many middle-income workers, like restaurant staff, healthcare employees or bus drivers, are often those who cannot telecommute,67 are thus pushed further away from the District, and their long and unpredictable commutes are potentially damaging to their places of employment. Yet, interest and employer engagement in the production of workforce housing is limited. Through stakeholder interviews, Pamela M. Blumenthal et al. (2017) link the lack of employer interest and leadership in workforce housing to the dominance of the federal government in the region that limits the impact of the private sector. Plus, many large employers such as defense contractors, hospitals, and hotels, have multiple small campuses, and therefore take advantage of the regional distribution of the workforce. In the District, the continuous influx of young, skilled workers who can live in nearby smaller units alleviates the workforce pressures for most professional and management firms.
A preference shift to smaller housing units accompanied by policies that allow urban fill can also help. We show in this study that the occupation of larger units by smaller households—couples, singles, and sometimes seniors—is a major pressure point on the District’s housing market. The city has taken an important step in allowing the development of Auxiliary Dwelling Units to enable urban fill, especially when moving houses or downsizing is financially difficult or would separate the residents from their communities. But, the current composition of the housing stock partly reflects the demand for more space—a backyard, an extra room for guests, an office or room for hobbies, or a basement for storage. The desire for space will always work against allowable density increases, regardless of the regulatory regime. For cities to take advantage of their potential density, at least some of the residents must develop a preference for living in smaller spaces—not just microunits for couples or singles, but also the types of units in which families live in high-density cities elsewhere, such as two or three-bedroom flats in multifamily buildings. Some neighborhoods fear density because of the potential traffic congestion, higher incidence of crime, and other factors. They worry that increasing density will change the neighborhood characteristics. But higher density cities are more efficient, with greater public transportation use, shorter journeys, and smaller carbon footprints. Density also fosters economic activity such as restaurants, grocery stores, and other businesses are attracted to places with many people. Additionally, density does not always imply height: population density in Paris—a uniformly low-rise city—is 55,673 persons per square mile, which is nearly five times the District (11,367 persons per square mile). Educating residents on the benefits of density can allow the city to make most of is scarce land.
The findings of our study highlight the need for a shift in thinking in how residents envision the future of the District and its neighborhoods. Constraining new residential development or having it take place in only a few designated areas of the city will exclude low and middle-income families from the District. A more inclusive city must have more mixing of incomes and household types across its neighborhoods, and less of a divide between where its rich and poor residents live. But this is only possible by building more housing. Our study suggests that relieving zoning restrictions in parts of the city with amenities desired by families, while using city resources to improve the public amenities in others to make the current stock more attractive is crucial. But these changes must also harness other forces that change the supply and demand patterns: a more regional focus, more engagement from employers, and an increasing preference for denser neighborhoods.
Methodology and data
The methodology for this report can be read on our datablog write-up and the data used can be downloaded in spreadsheet format.
Acknowledgements
The author is grateful to David Alpert, Tom Borger, Jen Budoff, Kevin Clinton, Chelsea Coffin, Cheryl Cort, Norton Francis, Tom Gallagher, Patrick Mcananey, Danilo Pelletiere, Kitty Richards, Peter Tatian, Stephen Swaim, Sandy Wilkes, Joe Wolfe, Kathryn Zickuhr, and Claire Zippel for reviewing and providing comments and suggestions on earlier drafts. Simone Roy developed the interactive graphs.
Endnotes
- The literature on the impact of limited housing supply and economic segregation is vast. See Zuk et. al. (2015) for a comprehensive review. Concentration of poverty is well documented (Lichter, Parisi, and Taquino 2012), and appears to be stronger when one compares jurisdictions (Bischoff and Readon 2013). Mobility within metro area can help reduce segregation (Sharkey 2012). And metro areas with lower density have seen deeper segregation (Fry and Taylor 2012). And housing segregation is deeply connected to wealth building and racial disparities (McKernan et al 2013).
- Rusk (2017b).
- See, for example, Urban Land Institute (2009), with a regional focus.
- This is a jarring figure, but in fact, compares favorably to New York City (99 percent of listing out of reach), San Francisco (91 percent) and Los Angeles (85 percent). Governing Magazine, Family Housing Affordability in U.S. Cities, November 2015. Available at http://www.governing.com/gov-data/other/family-housing-affordability-in-cities-report.html
- Ibid.
- See for example, Tatian et al (2015), Zippel (2016), Hendey, Tatian, and MacDonald (2014), and DHCD (2016).
- Strauss (2018) shows that while the entire region appears to be losing households earning between $30,000 and $100,000, the losses are extremely steep in D.C. compared to the inner and outer counties of the Metropolitan Washington Area. Also see the District of Columbia Fiscal Year 2017 Comprehensive Annual Financial Report, Exhibit S-2H which shows that the share of income tax filers who report incomes of $75,000 or more has increased from 20.5 percent to 30.1 percent between 2008 and 2017, and the share of income tax filers with incomes $50,000 or less has declined from 67 percent to 54.6 percent. Some of this change is inflationary, and some is due to demographic changes. Also see Jackson (2017) for an analysis that shows that household that leave the city tend to have lower incomes than those that stay.
- Urban Land Institute (2009).
- Sayin Taylor (2017), Broadening our thinking on the District: The Framework for the D.C. Policy Center, Washington D.C.: D.C. Policy Center. Available at https://www.dcpolicycenter.org/publications/broadening-thinking-dc-policy-center/
- Based on ACS data compiled by Kidscount.org.
- D.C. Department of Housing and Community Development (2015).
- See D.C. Department of Housing and Community Development (2017) for information on the Inclusionary Zoning program and the types of residents it serves.
- A similar law (DOPA) allows for the District to purchase property to revert to affordable housing, but the city must issue regulations to implement these laws before exercising such purchases.
- See for example the following report from the Washington Post.
- These programs sometimes work against each other. Tax breaks that award long-term ownership, for example, make it harder for empty nesters to downsize.
- Schuetz and Murray (2018).
- These differences in opinion are not unique to the District. For example, see Cutler (2014) on the fierce debate on how to solve San Francisco’s housing crises, Glaeser et. al (2005) on NYC, Glaeser and Ward (2010) on Boston. California Senate is now considering a new bill (SB 82 before the California Senate, which would preempt local law and require that all areas within a half-mile of a high-frequency transit stop, or within a quarter mile of a bus or transit corridor, allow heights of at least 45 or 85 feet (depending on distance from transit, width of street, and other characteristics). Some view state preemption as the only way to reduce housing costs, while other oppose the proposal arguing that it would increase housing costs in the future, create a windfall to landowners without capturing any value for public investments, or create future opposition to expansions in transportation (Roberts, 2018).
- D.C. Policy Center estimates based on the methodology explained in the Methodology section.
- D.C. Policy Center estimate based on ACS single year estimates for 2016 for occupied housing stock and the distribution of the number of persons occupation a housing unit (ACS 2012-2016 data summaries). There are also an estimated 22,668 vacant units in the District’s housing stock.
- Taylor 2015.
- The Zuk and Chapple (2016) study challenges the findings from the LAO study by arguing that the measures use in the study exclude other benefits subsidized housing offer. But in the process, they also find that construction of more market-rate housing also results in a reduction of the displacement indicator, and this effect is about half the size of the effect from subsidized housing.
- It is important to note that Census estimates are not precise and subject to revisions, which can sometimes be large.
- There is no agreement on how many households are in the District. The Census, the Office of Planning, and forecasters such as Moody’s and Global Insight all produce different numbers for the same year.
- This estimate is different from the ACS estimates which show about 307,000 housing units. Other data sources suggest that the construction of new housing units could be better at keeping pace with population and household growth. CoStar data on apartment units reported in the monthly Office of Revenue Analysis Economic and Revenue Trends Reports show that over the past five years there was a net increase of 22,192 rental units in 178 new buildings. The city also added several thousand new condominiums and some single-family houses. Occupied units during the same period increased by 19,900 units. The same report provides an estimate of 24,120 new households, which is more in balance with new construction. CoStar also lists about 13,000 new units being constructed, which can accommodate a population increase of about 10,000 per year. For details see DC Office of Revenue Analysis (2018).
- The source for this data is U.S. Census Bureau, 2012-2016 American Community Survey 5-Year Estimates.
- Compared to DC’s 39 percent, in Manassas Park, only 8.5 percent of the housing units have one or no bedrooms. Even in the urban Montgomery County, the share of studio or 1-bedroom units is 14.1 percent
- These metrics vary greatly across metropolitan areas, This map here shows the metrics for other metropolitan areas including how things changed between 2010 and 2016.
- To compare, ACS estimates of housing units in DC for 2016 is slightly over 306,000.
- This number excludes units set aside for short-term rentals, which we estimate to be about 1.5 percent of the total housing stock. A recent D.C. Policy Center analysis shows that there are 7,800 homes that are offered as short-term rentals just through Airbnb, and an estimated 4,800 of these units are active listings for entire homes. A quarter of these units have at least 10 stays throughout the year, suggesting that they primarily serve as short term rentals. For details, see Rabinowitz (2018).
- We estimate that 60 percent of condominiums and 70 percent of coops are rental units
- The match of building identification numbers to single family identification numbers shows a slightly higher number of units than buildings. Spot-checking the data, we find 66 units in 19 structures classified as “nonconforming single-family units” in the tax rolls that cause this discrepancy.
- It is important to note that the tax rolls or the CAMA data do not make a distinction between buildings with Accessory Dwelling Units or English basements. To this extent, we are undercounting the number of units. A check of ACS data for housing characteristics show 122,000 housing units with one or no bedrooms. Using tax data, we find about 20,000 more. This suggests that lack of information on ADUs or small basement units, though important, does not negate our findings.
- In this study, we use tax assessment neighborhoods as units of analysis because the tax rolls allow us to map homes only to these neighborhoods. Our interactive maps, however, display neighborhood names that would be more familiar to the residents. The full map of assessment neighborhoods is available in the appendix.
- In addition, 12 percent of District land is set-aside for industrial zoning, 80 percent of which are warehouses, and nearly half, one-story warehouses.
- The map is missing about 33,000 units because the two spatial datasets we used did not include the SSL numbers in the tax rolls.
- Close inspection of some of the units shows some coding or matching errors (very small lots with the unlikely classification of apartments, and condominium units in what are likely row houses), but there are sufficiently strong data points to render the map useful.
- Variations in average household size has a profound effect on the type of population density a certain mix of housing types can produce. When average household size is small, the single-family structures do not allow for “efficient packing” of people. See, for example, Taylor (2008).
- See, for example, this essay from Upshot: https://www.nytimes.com/2017/08/24/upshot/how-redlinings-racist-effects-lasted-for-decades.html.
- These neighborhoods are where the District’s black population settled in the 1950s and 1960s, when the city’s white population started leaving for the suburbs after the Supreme Court decision in 1954 that forced the District to integrate its schools. For details, see Asch and Musgrove (2017), pp.304-19. Much of the senior housing in Michigan Park, Riggs Park, Woodridge, Brookland and Hillcrest can be traced to purchases made in the 1950s or 1960s.
- For details, see the following information from the Office of the Chief Financial Officer.
- This cap, though popular, can cause significant disparities between long-term residents and new residents in the amount of taxes paid for similarly valued properties. It also does not work well during downturns: during the Great Recession, some homeowners complained that their taxes went up despite a reduction in their assessed property values. This is because the taxes were still catching up with valuation increases in earlier years. For details, see the following information from the Office of the Chief Financial Officer.
- The real property tax cap cannot reduce taxable assessments below 40 percent of the market assessment, but the combination of homestead exemption and the cap could. Real property tax rolls show 195 properties with taxable assessment below 40 percent of their market assessment. We excluded these outlier properties from our maps.
- It is important to note that the same map used to measure the total amount of taxes forgone at the neighborhood level would look very different. This is because while the share of value not taxed in high-priced neighborhoods is low, the valuation amount that is not taxed is much higher. By this metric, the greatest benefits accrue to west of the park neighborhoods, Capitol Hill, and parts of the Central assessment neighborhood.
- These include LADHO properties (where only the land is exempted from tax) as well as others that qualify for exemptions under D.C. Code, sometimes by right and other times by specific legislative exemptions.
- To compare, Zillow’s estimate for the median value per square foot. across all types of homes in DC is $494, but their estimate is based on a sample that omits some neighborhoods east of the Anacostia River.
- We restrict this visual at $1,500 per square foot valuation. Our methodology produces 7,800 units with values above $1,500 per square foot. We include them in the analysis, but to make the graph easier to read, we exclude them from the view.
- For this analysis, we are excluding subsidized housing units.
- We are assuming a borrowing cost of 6 percent
- One comment we got from one of the early reviewers of this study is that the 30 percent limit for housing burdens is ill-suited to some households in the District, especially childless, carless couples with fewer non-discretionary expenditures items that those one usually sees in the budgets of families. Because we are focusing on families, we kept our analysis at 30 percent, which also makes our estimations more conservative (identifying fewer units potentially affordable to singles and couples). But if we were to use higher income shares available for housing expenditures for singles and couples we would find that these smaller households can potentially compete for even more units than we estimate, and competition from singles and doubles for family-sized housing would be even fiercer.
- It is important to note that there are significant limitations in using the AMI for measuring buying power in the District. We stick to this measure because most discussions on housing affordability, and all government policies that aim to increase affordable housing units use AMI. The reader should note that DC Median Income is lower ($85,000) and has an unusual distribution where smaller household have higher incomes than larger households.
- If one were to include appropriately sized cooperatives and condominiums, the number would have increased by about 1,000.
- Housing affordability is measured against the area median income. The District’s median family income in 2016 is estimated at $98,000, which is below the Area Median Income.
- This does not mean that there are two wage-earners or two adults in the household; the data simply states the reported household income in households with two persons and include households with a single parent and a child or two adults sharing the space.
- See the essay by David Rusk, “Segregation by Income is Replacing Segregation by Race” D.C. Policy Center
- Asch & Musgrove, 2017.
- Ibid.
- For a full list of all affordable housing initiatives in the District and surrounding jurisdictions, See Sturtevant (2016)
- Sturtevant and Chapman (2013). The authors, based on population and job growth projections, estimate that the entire metro region must build more than 344,000 single-family units and more than 203,000 multifamily units.
- Since 2010, the District has met this number twice, first in 2015 with 5386 new occupancy (through both new units and reduced vacancy) and then in 2017 with 6,086 new occupancy. In other years, the number of newly occupied units varied from 1,458 to 5,180.
- Roy (2017).
- Florida (2015).
- Ganong and Shoag (2013) examined historical data on income and migration going back to 1880 to show that over the past few decades housing prices in some high-income cities have risen so much that only the most educated people find it worthwhile to live there. Americans without a college degree are moving away from the most productive places in search of cities that offer a better standard of living after housing costs.
- For example, subsidized housing units have been built mostly in low-income areas in the city, worsening economic segregation. According to the Affordable Housing Database published on the Open Government website, as of October of 2017, 46 percent of District’s affordable units that resulted from the District’s various production and preservation programs were in Wards 7 and 8. Furthermore, these two Wards hosted 58 percent of the units that are affordable for the lowest income residents, who most likely need subsidies to pay for housing. In contrast, Wards 2 and 3 housed 6 percent of all affordable units and only 1 percent of units affordable to the poorest residents.
- Sturtevant (2016).
- Sturtevant (2015).
- The District government provides some limited support for workforce housing programs. For example, the DC Department of Housing and Community Development (DHCD) auctions off vacant property to be redeveloped as “workforce housing, vibrant green space, and spur economic development.” There are approximately 90 sites in the program, and the first auction took place in January 2018 for 36 lots that will be redeveloped as approximately 50 workforce housing units. The website for the company that organized the auction shows 34 of these lots have been sold. For details, see https://realestate.alexcooper.com/auctions/1-MZ7GG/the-district-of-columbia-as-part-of-the-vacant-to-vibrant-dc-initiative-orders-the-auction-of-33-propertiesincluding-homes-residential-multi-unit-buildings-and-unimproved-lots. There is also some limited purchase assistance for first-time homebuyers.
- Strauss (2018).