Introduction
As we have shown in our more than a decade and a half of work on the topic, there has been a long-trending erosion of teacher wages and compensation relative to other college graduates.1 Simply put, teachers are paid less (in wages and compensation) than other college-educated workers with similar experience and other characteristics, and this financial penalty discourages college students from entering the teaching profession and makes it difficult for school districts to keep current teachers in the classroom.
![]()
This report was produced in collaboration with the Center on Wage and Employment Dynamics at the University of California, Berkeley.
Teacher compensation is not just an issue of staffing: Effective teachers are the most important school-based determinant of student educational performance. To promote children’s success in school, schools must retain credentialed teachers and ensure that teaching remains an attractive career option for college-bound students. Our previous report (Allegretto and Mishel 2019) explains in more detail why providing teachers with a decent middle-class living commensurate with other professionals with similar education is not simply a matter of fairness but necessary to enhance student and economic performance.
We provide this update to our long-standing series on the teacher wage and compensation penalty as the U.S. continues to struggle with the COVID-19 pandemic and the economic consequences. While the data in this paper are through 2019 and thus predate the pandemic, our analysis may provide useful insights as schools struggle to reopen. As a country we have yet to make the necessary investments, and pass the needed policies and procedures (e.g., universal mask requirements and testing, tracing, and isolating protocols) that would allow us to achieve some semblance of normalcy. Teachers and other school staff will continue the business of educating students in these trying times. They and their unions will play a critical role in moving forward in an effective and safe environment.
Key findings
- The teacher wage penalty has grown substantially since the mid-1990s. The teacher wage penalty is how much less, in percentage terms, public school teachers are paid in weekly wages relative to other college-educated workers (after accounting for factors known to affect earnings such as education, experience, and state residence). The regression-adjusted teaching wage penalty was 6.0% in 1996. In 2019, the penalty was 19.2%, reflecting a 2.8 percentage-point improvement compared with a penalty of 22.0% a year earlier.
- The teacher wage penalty declined in the wake of recent teacher strikes but only time and more data will reveal whether teachers’ actions led to a decline and a turning point. The lessening of the teaching penalty from 22.0% in 2018 to 19.2% in 2019 may reflect pay raises enacted in the wake of widespread strikes and other actions by teachers in 2018 and 2019, particularly in some of the states where teacher pay lagged the most. Unfortunately, the data we have to date are not sufficient to allow us to identify the geographic locus of the improvements in teacher wages and benefits and any association with the recent wave of teacher protests and strikes. Only time will tell if this single data point marks a turning point in teacher pay.
- The wage premium that women teachers experienced in the 1960s and 1970s has been replaced by a significant wage penalty. As noted in our previous research, women teachers enjoyed a 14.7% wage premium in 1960, meaning they were paid 14.7% more than comparably educated and experienced women in other occupations. In 2019, women teachers were earning 13.2% less in weekly wages than their nonteaching counterparts were—a 27.9 percentage-point swing over the last six decades.
- The wage penalty for men in teaching is much larger than it is for women in the profession, and it too has worsened considerably. The teacher wage penalty for men was 16.6% in 1979. In 2019, male teachers earned 30.2% less than similar male college graduates who chose a different profession. This explains, to a large degree, why only one in four teachers are men.
- While teacher wage penalties have worsened over time, some of the increase may be attributable to a tradeoff school districts make between pay and benefits. In other words, school districts may not be giving teachers raises but are instead offering stable or slightly better benefits, such that benefits make up a larger share of the overall compensation package for teachers than for other professionals. In 2019, nonwage benefits made up a greater share of total compensation for teachers (29.3%) than for other professionals (21.4%). In 2004, nonwage benefits share of compensation was 20.7% for teachers and 18.7% for other professionals.
- The benefits advantage of teachers has not been enough to offset the growing wage penalty. The teacher total compensation penalty was 10.2% in 2019 (composed of a 19.2% wage penalty offset by a 9.0% benefits advantage). The bottom line is that the teacher total compensation penalty grew by 7.5 percentage points from 1993 to 2019.
- The teacher wage penalty exceeds 20% in 21 states and in the District of Columbia. Teacher weekly wage penalties for each state, computed using pooled 2014–2019 data, range from 2.0% in Wyoming to 32.7% in Virginia. In 21 states and the District of Columbia teachers are paid less than 80 cents on the dollar earned by similar college-educated workers.
The analyses
In our analyses, we use two sources of data, both from the Bureau of Labor Statistics (BLS). For our wage analysis, we use Current Population Survey Outgoing Rotation Groups (CPS-ORG) data. Our wage sample is restricted to full-time workers (working at least 35 hours per week), 18 to 64 years old, with at least a bachelor’s degree. The education restriction is made because teachers today need at least a bachelor’s degree to teach. We compare wages of public school teachers (elementary, middle, and secondary) with other college graduates using regression-adjusted estimates. Since there are no CPS surveys that provide data on both benefits and wages for teachers and other college graduates, our benefits analysis uses National Compensation Survey data from BLS’s Employer Costs for Employee Compensation (ECEC) program to compare teachers’ benefits with benefits of professionals overall. Specifically, we pull data on employer costs per hour worked for detailed categories of compensation for “Primary, secondary, and special education school teachers” and “civilian professionals”—the broadest category available that corresponds with all college graduates.
We present results in three sections. We begin by presenting estimates of the national teacher weekly wage penalty using standard regression techniques to control for systematic differences in the age, education, state of residence, and other factors known to affect wage rates. Second, we present similarly constructed estimates of relative teacher earnings for each state. Finally, we factor in nonwage benefits to estimate a total compensation penalty that includes wages and benefits at the national level (which is not possible for each state).
Appendix A in our previous report (Allegretto and Mishel 2019), available online, provides a comprehensive discussion of the data and methodologies that produce our teacher weekly wage and total compensation penalties. Following are just a few salient aspects to mention. First, in our wage penalty analyses, our sample of workers is limited to those who respond with wage information (i.e. we exclude those with imputed wage data) because BLS’s method of imputing earnings overstates teacher earnings. Second, our measure of wages is weekly wages and therefore avoids comparisons of weekly hours worked or length of the work year (i.e. the “summers off” issue for teachers) between teachers and other college graduates. In Allegretto and Mishel 2019 we provide evidence that teachers work weekly hours similar to other professionals. Third, we make adjustments to the wage data to account for the fact that the CPS “top-codes” weekly earnings—assigning all earners above a particular threshold a week a weekly wage exactly at that threshold. Done to protect confidentiality, this top code hasn’t been updated for inflation since 1998 and, as a result, a growing share of workers are assigned this weekly earnings value, which has generated a growing understatement of college graduate wages.
Teacher relative weekly wage trends: Regression-adjusted estimates
An apples-to-apples comparison of earnings between teachers and nonteacher college graduates requires us to control for any systematic differences in factors that typically affect pay, including a worker’s age, formal education (B.A., M.A., professional degree, and Ph.D.), marital status, race/ethnicity, and state of residence. To do this, we use standard regression techniques to calculate the weekly wages of public school teachers relative to other college graduates.2 We do this for all teachers, and separately for women and men.
We present relative wages as percentage differences from the perspective of teachers, i.e., how much less (or more) teachers earn in weekly wages relative to other college graduates. We find a weekly wage penalty for teachers when the regression estimates suggest that teachers, all else equal, are paid less than other college graduates, which appears as a negative number in Figure A. Figure A reports results for all teachers, and by gender. For all teachers, the penalty grew from 7.1% in 1979 to a record 22.0% in 2018 before improving to 19.2% in 2019. The estimated 19.2% teacher weekly wage penalty in 2019 means that, on average, teachers earned just 80.8 cents on the dollar compared with what similar college graduates earned working in other professions—and much less than the relative 92.9 cents on the dollar that teachers earned in 1979.
Teachers earn 19.2% less than comparable college graduates: Teacher weekly wage penalty (or premium) for all teachers and by gender, 1979–2019
| All | Women | Men | All | Women | Men | All | Women | Men | |
|---|---|---|---|---|---|---|---|---|---|
| 1979 | -7.06% | 6.53% | -16.64% | ||||||
| 1980 | -9.31% | 4.48% | -19.17% | ||||||
| 1981 | -10.06% | 3.12% | -18.97% | ||||||
| 1982 | -10.21% | 2.84% | -19.36% | ||||||
| 1983 | -11.82% | 1.04% | -20.72% | ||||||
| 1984 | -10.04% | 2.48% | -19.68% | ||||||
| 1985 | -10.22% | 1.87% | -19.54% | ||||||
| 1986 | -8.79% | 3.18% | -18.36% | ||||||
| 1987 | -7.89% | 3.85% | -18.08% | ||||||
| 1988 | -8.01% | 5.12% | -18.17% | ||||||
| 1989 | -8.21% | 3.04% | -17.00% | ||||||
| 1990 | -7.73% | 4.03% | -17.87% | ||||||
| 1991 | -9.07% | 0.63% | -16.33% | ||||||
| 1992 | -7.01% | 3.08% | -15.57% | ||||||
| 1993 | -5.05% | 4.11% | -13.05% | -5.05% | 4.11% | -13.05% | |||
| 1994 | – | ||||||||
| 1995 | – | ||||||||
| 1996 | -6.05% | -0.09% | -15.05% | -6.05% | -0.09% | -15.05% | |||
| 1997 | -6.17% | 1.21% | -18.63% | ||||||
| 1998 | -8.96% | -1.46% | -20.51% | ||||||
| 1999 | -10.44% | -2.70% | -21.68% | ||||||
| 2000 | -11.81% | -5.08% | -22.65% | ||||||
| 2001 | -12.10% | -4.03% | -25.32% | ||||||
| 2002 | -12.06% | -5.14% | -24.15% | ||||||
| 2003 | -11.28% | -4.89% | -21.18% | ||||||
| 2004 | -12.83% | -6.18% | -23.29% | ||||||
| 2005 | -13.25% | -6.30% | -24.49% | ||||||
| 2006 | -15.02% | -8.00% | -27.34% | ||||||
| 2007 | -11.70% | -4.68% | -23.45% | ||||||
| 2008 | -14.49% | -7.70% | -25.67% | ||||||
| 2009 | -12.46% | -4.53% | -24.65% | ||||||
| 2010 | -11.95% | -4.59% | -23.68% | ||||||
| 2011 | -12.78% | -6.45% | -24.19% | ||||||
| 2012 | -16.00% | -10.04% | -26.18% | ||||||
| 2013 | -16.39% | -10.13% | -27.28% | ||||||
| 2014 | -16.50% | -10.47% | -26.19% | ||||||
| 2015 | -18.38% | -13.36% | -26.73% | ||||||
| 2016 | -19.37% | -12.20% | -31.61% | ||||||
| 2017 | -20.90% | -15.54% | -30.46% | ||||||
| 2018 | -21.97% | -15.86% | -31.80% | ||||||
| 2019 | -19.20% | -13.19% | -30.18% |
Notes: Figure shows regression-adjusted weekly wage penalties (or premiums): how much less (or more), in percentage terms, elementary, middle, and secondary public school teachers earn in weekly wages than their college-educated, nonteaching peers. Data points for 1994 and 1995 are unavailable and represented by dotted lines. See Allegretto and Mishel 2019, especially Appendix A, for more details.
Extended notes: Figure shows regression-adjusted weekly wage penalties (or premiums): how much less (or more), in percentage terms elementary, middle, and secondary public school teachers make in weekly wages than their college-educated, nonteaching peers. College-educated workers refers to workers who have a bachelor’s degree or more education. The dependent variable is (log) weekly wages with indicator controls on public school teacher, private school teacher, gender, and married, along with indicator sets on education (M.A., professional degree, Ph.D.) and race/ethnicity (black, Hispanic, other); also included are age (as a quartic) and state fixed effects. Estimates are omitted for 1994 and 1995, as imputation flags are incomplete or not available; data points for these years are represented by dotted lines. See Allegretto and Mishel 2019, especially Appendix A, for more details.
Source: Authors’ analysis of Current Population Survey Outgoing Rotation Group data accessed via the EPI Current Population Survey Extracts, Version 1.0.2 (EPI 2020).
Teacher wage differentials vary greatly by gender. As illustrated in Figure A, the teacher penalty currently stands at 13.2% for women—a 2.7 percentage point lessening of the penalty compared with 2018. The teaching profession was relatively good for women in 1979, when they had a weekly wage premium of 6.5%.
In earlier work using decennial Census data, we found a 14.7% wage premium for women teachers in 1960 that fell to 10.4% in 1970 and to 2.9% in 1980 (Allegretto, Corcoran, and Mishel 2008, p. 7).3 Of course, falling relative wages for female teachers coincided with slowly expanding opportunities for women to work in other fields—an important concept to keep in mind. The earlier work combined with the results in Figure A demonstrates a sizable, long-term trend in the relative erosion of earnings for women teachers.
The teacher wage penalty has always been largest for men in the teaching profession—the men’s weekly wage penalty was 16.6% in 1979 and grew to a record 31.8% in 2018. The penalty fell to 30.2% in 2019, still representing an extreme contrast in earnings. The shrinking of the wage penalties for women and, less so, for men in 2019 should not necessarily be taken as a reversal of trends. As Figure A illustrates, earlier instances of improvements in relative teacher wages have been short-lived and followed by worsening relative teacher earnings. This time may be different, however, as attitudes toward teachers and their pay have changed and teachers themselves are strongly pushing for improvements (see, for example, Phi Delta Kappan 2018; Vargas 2020).4
The larger teacher wage penalty for men reflects that teaching has been a predominantly female profession. Men in predominantly female professions often earn substantially less than men earn in male-dominated professions (Corcoran, Evans, and Schwab 2004). Because of gender discrimination that historically limited occupational options for educated women, these women became a captive labor pool with few opportunities and less leverage to secure higher wages. Thus, the wages for teachers have remained below those in male-dominated professions.
The large wage penalty that men face in the teaching profession goes a long way toward explaining why the gender makeup of the profession has not changed much over the past few decades. Today, roughly three-fourths of teachers are women, which is about what it was in 1960.5
Teacher weekly wage penalties by state
To this point, our focus has been on public school teacher wage penalties, on average, for the United States. Here we present regression-adjusted teacher wage penalties by state. To analyze teacher earnings by state, we pool together six years of CPS data from 2014 through 2019. Again we compare samples of public school teachers with samples of nonteacher college graduates within each state.
In Figure B we present state outcomes in a bar chart, ranked from the largest wage penalty to the smallest (Figure C presents the data in an interactive map). Teacher weekly wage penalties in 21 states and D.C. are greater than 20%. Of the eight states with the largest wage penalties, four (those italicized) were where massive walkouts took place in 2018: Virginia (32.7%) had the largest penalty, followed by Arizona (31.8%), New Mexico (29.5%), Oklahoma (29.0%), Colorado (28.8%), Washington (28.1%), Oregon (27.3%) and North Carolina (25.3%).6 The teaching penalty also exceeded 25% in Georgia (25.1%).
The teacher weekly wage penalty is greater than 20% in 21 states and D.C. : Teacher weekly wage penalty, by state, pooled data from 2014–2019
| State | Weekly wage penalty |
|---|---|
| Virginia | -32.7% |
| Arizona | -31.8% |
| New Mexico | -29.5% |
| Oklahoma | -29.0% |
| Colorado | -28.8% |
| Washington | -28.1% |
| Oregon | -27.3% |
| North Carolina | -25.3% |
| Georgia | -25.1% |
| Alabama | -24.6% |
| Missouri | -24.1% |
| Louisiana | -23.3% |
| Utah | -23.3% |
| Maine | -23.1% |
| Minnesota | -22.5% |
| Kentucky | -22.2% |
| Texas | -21.9% |
| Kansas | -21.8% |
| Tennessee | -21.4% |
| Indiana | -21.3% |
| District Of Columbia | -21.3% |
| Idaho | -20.9% |
| Wisconsin | -19.9% |
| Montana | -19.4% |
| Florida | -19.3% |
| Illinois | -18.7% |
| West Virginia | -18.2% |
| New Hampshire | -18.2% |
| South Dakota | -18.0% |
| Massachusetts | -18.0% |
| Nebraska | -17.7% |
| Arkansas | -17.7% |
| Nevada | -16.6% |
| North Dakota | -16.4% |
| Michigan | -15.9% |
| California | -15.5% |
| Ohio | -15.2% |
| Mississippi | -15.2% |
| Iowa | -14.7% |
| Connecticut | -13.5% |
| South Carolina | -13.4% |
| Pennsylvania | -13.0% |
| Vermont | -12.7% |
| New York | -12.0% |
| Maryland | -11.4% |
| Hawaii | -10.9% |
| Delaware | -9.8% |
| Alaska | -9.7% |
| New Jersey | -3.1% |
| Rhode Island | -2.1% |
| Wyoming | -2.0% |
Notes: Figure reports state-specific regression-adjusted teacher weekly wage penalties: how much less, in percentage terms, elementary, middle, and secondary public school teachers earn in weekly wages than their college-educated, nonteaching peers. See Allegretto and Mishel 2019, especially Appendix A, for more details.
Extended notes: Figure reports state-specific regression-adjusted teacher weekly wage penalties: how much less, in percentage terms, elementary, middle, and secondary public school teachers earn in weekly wages than their college-educated, nonteaching peers. College-educated workers refers to workers who have a bachelor’s degree or more education. The dependent variable is (log) weekly wages with indicator controls on public school teacher, private school teacher, gender, and married, along with indicator sets on education (M.A., professional degree, Ph.D.) and race/ethnicity (black, Hispanic, other); also included are age as a quartic and state fixed effects. See Allegretto and Mishel 2019, especially Appendix A, for more details.
Source: Authors’ analysis of pooled 2014–2019 Current Population Survey Outgoing Rotation Group data
How underpaid are teachers in your state?: Depending on the state, teachers make between 2.0% and 32.7% less than other comparable college-educated workers
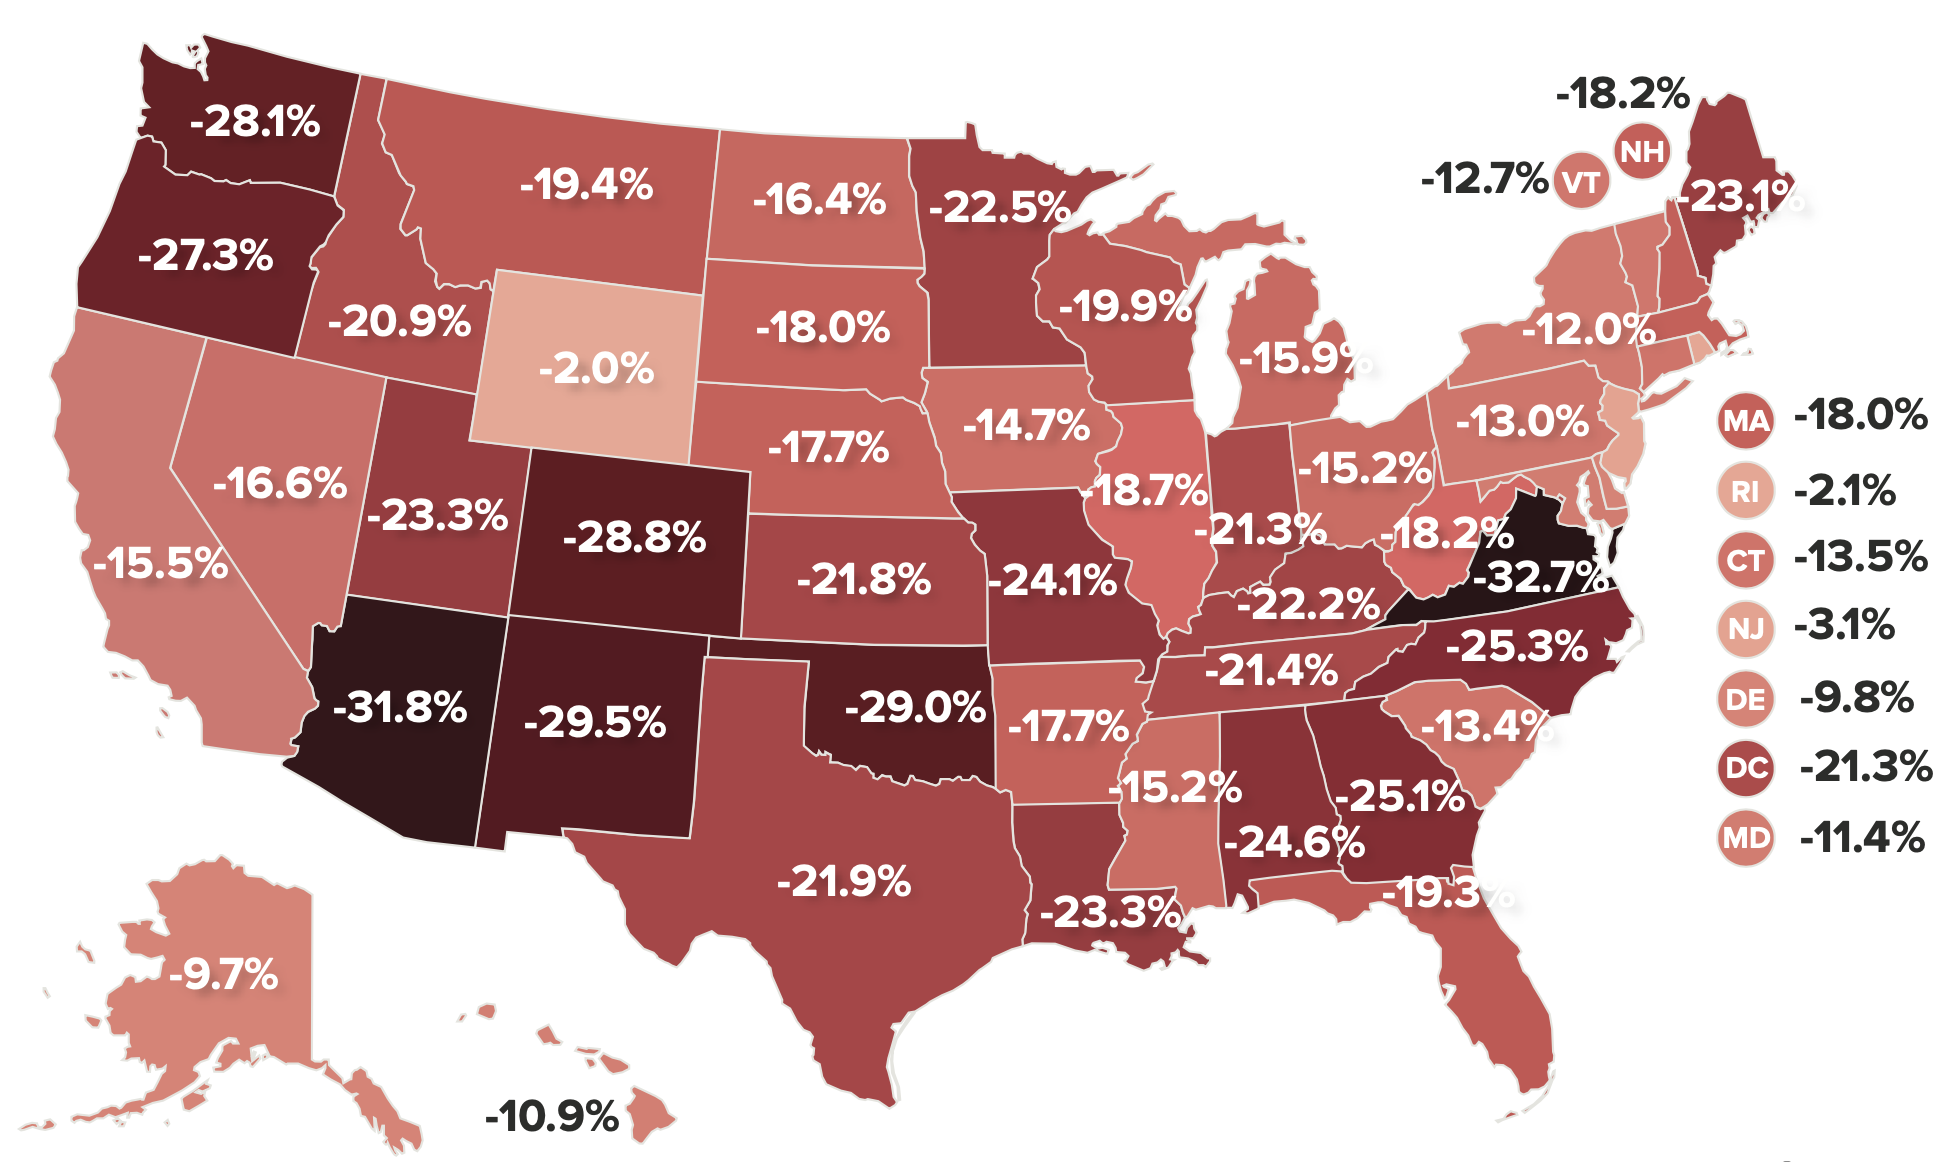
Notes: Figure reports state-specific regression-adjusted teacher weekly wage penalties: how much less, in percentage terms, elementary, middle, and secondary public school teachers earn in weekly wages than their college-educated, nonteaching peers. See Allegretto and Mishel 2019, especially Appendix A, for more details.
Extended notes: Figure reports state-specific regression-adjusted teacher weekly wage penalties: how much less, in percentage terms, elementary, middle, and secondary public school teachers earn in weekly wages than their college-educated, nonteaching peers. College-educated workers refers to workers who have a bachelor’s degree or more education. The dependent variable is (log) weekly wages with indicator controls on public school teacher, private school teacher, gender, and married, along with indicator sets on education (M.A., professional degree, Ph.D.) and race/ethnicity (black, Hispanic, other); also included are age as a quartic and state fixed effects. See Allegretto and Mishel 2019, especially Appendix A, for more details.
Source: Authors’ analysis of pooled 2014–2019 Current Population Survey Outgoing Rotation Group data accessed via EPI Current Population Survey Extracts, Version 1.0.2 (EPI 2020).
In no state, on average, does the relative wage of teachers surpass that of other college graduates. Wyoming, Rhode Island, and New Jersey have the smallest wage penalties—at 2.0, 2.1, and 3.1%, respectively.
Several of the states where teacher protests occurred in 2018–2019 continue to have some of the largest teacher wage disadvantages. In order to have a sample large enough to produce estimates separately for every state, we pooled together six consecutive years of data. This approach makes it impossible for us to determine, in a meaningful way, how the strikes affected wages since teacher activism exploded in 2018 and 2019—especially as many of the actions were at the city level. As a result, for now, we can only note that the teacher earnings gap did narrow at the national level in 2019 and that teacher mobilizations in 2018 and 2019 were concentrated in the states that continue to have some of the largest teacher pay penalties.7
Adding benefits to the picture
Our analysis thus far has focused entirely on teachers’ weekly wages relative to those of other comparable college graduates. Yet benefits such as pensions and health insurance are an increasingly important component of the total compensation package. Teachers do enjoy more attractive benefits packages than other professionals; thus, our measure of relative teacher wages overstates the teacher disadvantage in total compensation.8
Table 1 provides the basic information necessary to compare benefits packages of primary, secondary, and special education public school teachers with benefits packages of comparable workers (specifically, workers in professional occupations).9 This table draws on the BLS Employer Costs for Employee Compensation (ECEC) series. “Benefits” in our analysis refers to the employer costs for health and life insurance, retirement plans, and payroll taxes (i.e., Social Security, unemployment insurance, and workers’ compensation). The remaining components of compensation are “W-2 wages,” a wage measure that corresponds to the wages captured in the CPS data used above; W-2 wages are the wages reported to employees and to the Internal Revenue Service. W-2 wages include “direct wages,” defined by the BLS as “regular payments from the employer to the employee as compensation for straight-time hourly work, or for any salaried work performed” and other wage items including “supplemental pay.” Supplemental pay includes premium pay for overtime, bonus pay, profit-sharing, and “paid leave.”10
The teacher compensation penalty was 10.2% in 2019: Trends in the teacher compensation penalty and its components, 1979–2019
| W-2 wage share of compensation | Public school teachers | ||||
|---|---|---|---|---|---|
| Year(s) | Professionals | Public school teachers | Wage penalty | Benefits advantage | Compensation penalty |
| 1979 | n.a. | n.a. | -7.1% | n.a. | n.a. |
| 1993 | n.a. | n.a. | -5.1% | 2.4% | -2.7% |
| 2004 | 81.3% | 79.3% | -12.8% | 2.2% | -10.7% |
| 2007 | 80.7% | 77.2% | -11.7% | 4.0% | -7.7% |
| 2010 | 79.8% | 75.6% | -11.9% | 4.9% | -7.1% |
| 2017 | 78.1% | 71.4% | -20.9% | 7.4% | -13.5% |
| 2018 | 78.5% | 70.9% | -22.0% | 8.3% | -13.7% |
| 2019 | 78.6% | 70.7% | -19.2% | 9.0% | -10.2% |
| Percentage-point change | |||||
| 1979–1993 | n.a. | n.a. | 2.0 | n.a. | n.a. |
| 1993–2007 | n.a. | n.a. | -6.6 | 1.6 | -5.0 |
| 1994–2007 | -0.6 | -2.1 | n.a. | n.a. | n.a. |
| 2007–2019 | -2.1 | -6.5 | -7.5 | 5.0 | -2.5 |
| 2010–2019 | -1.2 | -4.9 | -7.2 | 4.1 | -3.2 |
| 2018–2019 | 0.1 | -0.2 | 2.8 | 0.7 | 3.4 |
| 1993–2019 | n.a. | n.a. | -14.1 | 6.6 | -7.5 |
Notes: Teachers are elementary, middle, and secondary public school teachers (compensation data do not include kindergarten teachers or special education teachers, who are included in the wage data). The benefits advantage is the degree to which teachers’ higher benefits relative to professionals offset their wage penalty. See Allegretto and Mishel 2019, especially Appendix A, for more details.
Note: Teachers are elementary, middle, and secondary public school teachers (compensation data do not include kindergarten teachers or special education teachers, who are included in the wage data). The regression-adjusted wage penalty is how much less teachers earn in weekly wages than their college-educated nonteaching peers. The benefits advantage is the degree to which teachers’ higher benefits relative to professionals offset their wage penalty. See Allegretto and Mishel 2019, especially Appendix A, for more details. Numbers may not sum to totals due to rounding.
Source: Authors’ analysis of Current Population Survey Outgoing Rotation Group data and Bureau of Labor Statistics Employer Costs for Employee Compensation data.
The first pair of columns in Table 1 under “W-2 wage share of compensation” present the share of W-2 wages in total compensation for professionals in all occupations and for state and local K–12 public school teachers. The W-2 wage share of compensation and the benefits share of compensation sum to one. These W-2 shares allow us to examine how important wages are relative to benefits in the total compensation package. In 2019, for example, teacher W-2 wages made up 70.7% of their total compensation. Professionals have less benefits per dollar of compensation, with 78.6 cents going to wages for every dollar of compensation (implying that 21.4 cents go to benefits). Therefore, for every dollar of W-2 wages, public school teachers do receive more in benefits. One reason health and pension costs are higher for teachers is that teacher health benefits are provided for a full year while teacher salaries are for less than a full year.
The columns under “Public school teachers” in Table 1 provide the information for our calculations. The “Wage penalty” column reports the teacher wage penalty from Figure B, followed by the “Benefits advantage” that teachers have; combining these two figures gives us an estimate for the teacher total compensation penalty, shown in the last column. In other words, the benefits advantage offsets the estimated relative wage disadvantage with respect to teachers.
The growth in the benefits advantage means that the relatively better benefits that teachers have somewhat offset the worsening wage picture for teachers. The benefits advantage for teachers in 2019 was 9.0%, significantly higher than the 2.4% teacher benefits advantage in 1993. The total teacher compensation penalty was 10.2% in 2019—an improvement over the previous year’s 13.7% penalty though 7.5 percentage points worse than the 2.7% compensation penalty for 1993.
Final thoughts
We have been sounding the alarm about the relative erosion of teacher earnings and total compensation for 16 years. Embedded in the worsening teacher wage penalty is the opportunity cost of choosing a career in teaching. As wages and compensation of teachers fall further behind that of other professionals it becomes harder to attract students to and retain teachers in the profession. These inequities must be addressed if we are to ensure that the brightest, most highly skilled professionals are at the head of each and every classroom, and to retain experienced teachers in the mix.11
Great challenges lay ahead as schools across the country open either virtually, in-person, or with a mix (Garcia and Weiss 2020). Even if schools had their budgets from last year, it would be more than a strain to invest in the supplies, protocols, and personnel needed to effectively and safely open up amid the pandemic. State and local revenue shortfalls due to the COVID-19-led recession have already materialized and public education employment has collapsed. As EPI economist Elise Gould (2020) pointed out, K–12 employment saw huge declines in April and May due to pandemic-induced shortfalls in revenue. In August, after a bit of a recent rebound, employment in K–12 education is down by 5.7%, or 462,100 jobs from February 2020 levels—at a time when schools are in need of more personnel. Importantly, this sector never fully recovered the jobs lost over the Great Recession—before the pandemic-induced job losses, there was a shortfall of over 300,000 local public education jobs if we take into account the growth in student enrollment (Gould 2020), thus we would add another approximately 300,000 to the recent 462,100 shortfall to capture the true breadth of the crisis.12
A return to the prepandemic economy is far off. It is not clear how much more cutting will be necessary as state legislators balance their budgets. It is only with the help of the U.S. Congress that we can remedy the draconian cuts. The money in relief packages, such as the CARES Act, has not been near enough. The federal government can borrow at zero interest and should do so to provide upwards of one trillion dollars to state and local governments (Bivens and Cooper 2020).
In the last recession and recovery, reduced spending for K–12 schools and the corresponding cutbacks in teacher salaries were conscious policy choices and were frequently done to accommodate tax cuts for corporations and the rich.13 It is critically important that these policy errors not be made again. Instead, state and local governments will need federal support to maintain and improve the resources that schools require, especially as adjustments to a COVID-19 environment add further expenses.
About the authors
Sylvia A. Allegretto is an economist and co-chair of the Center on Wage and Employment Dynamics, which is housed at the Institute for Research on Labor and Employment at the University of California, Berkeley. She is also a research associate of the Economic Policy Institute and is co-author of many EPI publications, including past editions of The State of Working America, How Does Teacher Pay Compare? and The Teaching Penalty: Teacher Pay Losing Ground. She has a Ph.D. in economics from the University of Colorado, Boulder.
Lawrence Mishel is a distinguished fellow and former president of the Economic Policy Institute. He is the co-author of all 12 editions of The State of Working America. His articles have appeared in a variety of academic and nonacademic journals. His areas of research include labor economics, wage and income distribution, industrial relations, productivity growth, and the economics of education. He has a Ph.D. in economics from the University of Wisconsin at Madison.
Acknowledgments
We thank Melat Kassa and Daniel Perez for excellent research assistance.
Endnotes
1. See How Does Teacher Pay Compare (Allegretto, Corcoran, and Mishel 2004); The Teacher Penalty (Allegretto, Corcoran, and Mishel 2008); and updated briefs (Allegretto, Corcoran, and Mishel 2011; Allegretto and Tojerow 2014; Allegretto and Mishel 2016, 2018, 2019).
2. The wage model includes controls for both public school teacher and private school teacher. The weekly wage penalty estimates are based on the coefficient on the public school teacher indicator.
3. In the 2008 analysis, the wage premium reflects a comparison of annual earnings of public school teachers with those of similarly educated workers, using a regression approach as in this paper.
4. In 2018, Phi Delta Kappan’s (PDK’s) annual poll of public attitudes toward public schools found that “Two-thirds [of Americans] say teacher salaries are too low, a new high in data since the first PDK poll in 1969.” It also found that “78% of public school parents say they would support teachers in their community if they went on strike for more pay.” In 2020, Theresa Vargas’s column in the Washington Post posited that the coronavirus pandemic was fueling a new appreciation for teachers across the country.
5. The 1960 share comes from Allegretto, Corcoran, and Mishel 2008 and is based on U.S. Census Bureau (Public-Use Microdata Samples, or PUMS) available at https://usa.ipums.org/usa/index.shtml; the current share comes from authors’ analysis of the CPS data set used for this 2020 report.
6. For more on teacher walkouts and strikes in 2018 see BLS 2019; Ballotpedia 2020; Romero, Healy, and Turkewitz 2018. Public school teachers in North Carolina and Oregon were also among those involved in the major work stoppages in 2019, according to BLS 2020.
7. BLS’s work stoppages reports present major work stoppages for educators at the municipal and state levels; see BLS 2019 and 2020.
8. We draw heavily on our prior work analyzing the “benefits bias”—which we now label the “benefits advantage” (see Allegretto, Corcoran, and Mishel 2004, 2008).
9. The ECEC provides compensation data for a narrower category of “primary, secondary, and special education school teachers” and for a broader category of “teachers.” We analyze the narrower category, which closely matches the definition of teachers in our CPS-ORG data, using data limited to state and local public-sector workers. The inclusion of kindergarten and special education teachers in the benefits analysis does not produce any more substantial differences than if they were excluded (as they are in the CPS sample used to estimate the wage penalty). Greater methodological detail is provided in Appendix A of Allegretto and Mishel 2019.
10. For details, see Appendix A of Allegretto and Mishel 2019.
11. See the reports in EPI’s “Teacher Shortage” series, at https://www.epi.org/research/teacher-shortages/, for discussions of pay inequities and other factors that dissuade professionals from entering or staying in the teaching profession.
12. Authors’ analysis of data from the Current Employment Statistics public data series. Additional shortfall estimate reflects the 43,300 shortfall in February 2020 from 2008 levels and the 261,100 more teachers needed to meet increases in student enrollment.
13. See for example Williams and Johnson 2013. Also Cooper (2020) explains how overall cuts in state and local public-sector budgets was a conscious choice over the alternative that many states did not take, which was to raise taxes; as Cooper notes, jurisdictions that did not cut public-sector workers fared better in the last recovery. For a summary of how K–12 education spending plummeted after the Great Recession, see Bivens 2017, Figure E.
References
Allegretto, Sylvia A., Sean P. Corcoran, and Lawrence Mishel. 2004. How Does Teacher Pay Compare? Methodological Challenges and Answers. Washington, D.C.: Economic Policy Institute.
Allegretto, Sylvia A., Sean P. Corcoran, and Lawrence Mishel. 2008. The Teaching Penalty: Teacher Pay Losing Ground. Washington, D.C.: Economic Policy Institute.
Allegretto, Sylvia A., Sean P. Corcoran, and Lawrence Mishel. 2011. The Teaching Penalty: An Update Through 2010. Economic Policy Institute Issue Brief no. 298, March 2011.
Allegretto, Sylvia A., and Lawrence Mishel. 2016. The Teacher Pay Gap Is Wider Than Ever: Teachers’ Pay Continues to Fall Further Behind Pay of Comparable Workers. Economic Policy Institute, August 2016.
Allegretto, Sylvia A., and Lawrence Mishel. 2018. The Teacher Pay Penalty Has Hit a New High: Trends in the Teacher Wage and Compensation Gaps Through 2017. Economic Policy Institute, September 2018.
Allegretto, Sylvia A., and Lawrence Mishel. 2019. The Teacher Weekly Wage Penalty Hit 21.4 Percent in 2018, A Record High. Economic Policy Institute, April 2019.
Allegretto, Sylvia A., and Ilan Tojerow. 2014. “Teacher Staffing and Pay Differences: Public and Private Schools.” Monthly Labor Review (U.S. Department of Labor, Bureau of Labor Statistics), September 2014.
Ballotpedia. 2020. “Statewide Public Education strikes, 2018” (web page), accessed September 10, 2020.
Bivens, Josh. 2017. Recommendations for States Facing Budget Shortfalls: Focus on Connecticut. Economic Policy Institute, May 2017.
Bivens, Josh, and David Cooper. 2020. “Without Federal Aid to State and Local Governments, 5.3 Million Workers Will Likely Lose Their Jobs by the End of 2021.” Working Economics Blog (Economic Policy Institute), June 10, 2020.
Bureau of Labor Statistics (BLS). 2019. “Major Work Stoppages in 2018” (news release). February 2019.
Bureau of Labor Statistics (BLS). 2020. “Major Work Stoppages in 2019” (news release) and “Work Stoppages Involving 1,000 or More Workers, 1993–2019” (related table), February 2020.
Bureau of Labor Statistics Employer Costs for Employee Compensation (BLS-ECEC). 2020. Employer Costs for Employee Compensation Historical Listing: National Compensation Survey, March 2004–March 2020.
Cooper, David. 2020. “Without Federal Aid, Many State and Local Governments Could Make the Same Budget Cuts that Hampered the Last Economic Recovery.” Working Economics Blog (Economic Policy Institute), May 27, 2020.
Corcoran, Sean P., William N. Evans, and Robert M. Schwab. 2004. “Women, the Labor Market, and the Declining Relative Quality of Teachers.” Journal of Policy Analysis and Management 23, no. 2: 449–470.
Economic Policy Institute (EPI). 2020. Current Population Survey Outgoing Rotation Group microdata for 1979–2019 from the Bureau of Labor Statistics, accessed via EPI Current Population Survey Extracts, Version 1.0.2 (2020), https://microdata.epi.org.
Economic Policy Institute (EPI). 2019. Methodology for Measuring Wages and Benefits. Last updated February 21, 2019.
Garcia, Emma, and Elaine Weiss. 2020. COVID-19 and Student Performance, Equity, and U.S. Education Policy: Lessons from Pre-pandemic Research to Inform Relief, Recovery, and Rebuilding. September 2020.
Gould, Elise. 2020. “Public Education Job Losses in April Are Already Greater Than in All of the Great Recession.” Working Economics Blog (Economic Policy Institute), June 3, 2020.
Phi Delta Kappan. 2018. The 50th Annual PDK Poll of the Public’s Attitude Toward the Public Schools: A Supplement to Kappan Magazine, September 2018.
Romero, Simon, Jack Healy, and Julie Turkewitz. 2018. “Teachers in Arizona and Colorado Walk Out Over Education Funding.” New York Times, April 26, 2020.
Shierholz, Heidi, and Margaret Poydock. Continued Surge in Strike Activity Signals Worker Dissatisfaction with Wage Growth. Economic Policy Institute, February 2020.
Williams, Erica, and Nicholas Johnson. 2013. ALEC Tax and Budget Proposals Would Slash Public Services and Jeopardize Economic Growth. Center on Budget and Policy Priorities. February 2020.
Vargas, Theresa. 2020. “The One Undoubtable Positive to Come of the Coronavirus: A New Appreciation of Teachers.” Washington Post, March 18, 2020.
