Climate Matters•November 28, 2018
Seasonal Warming
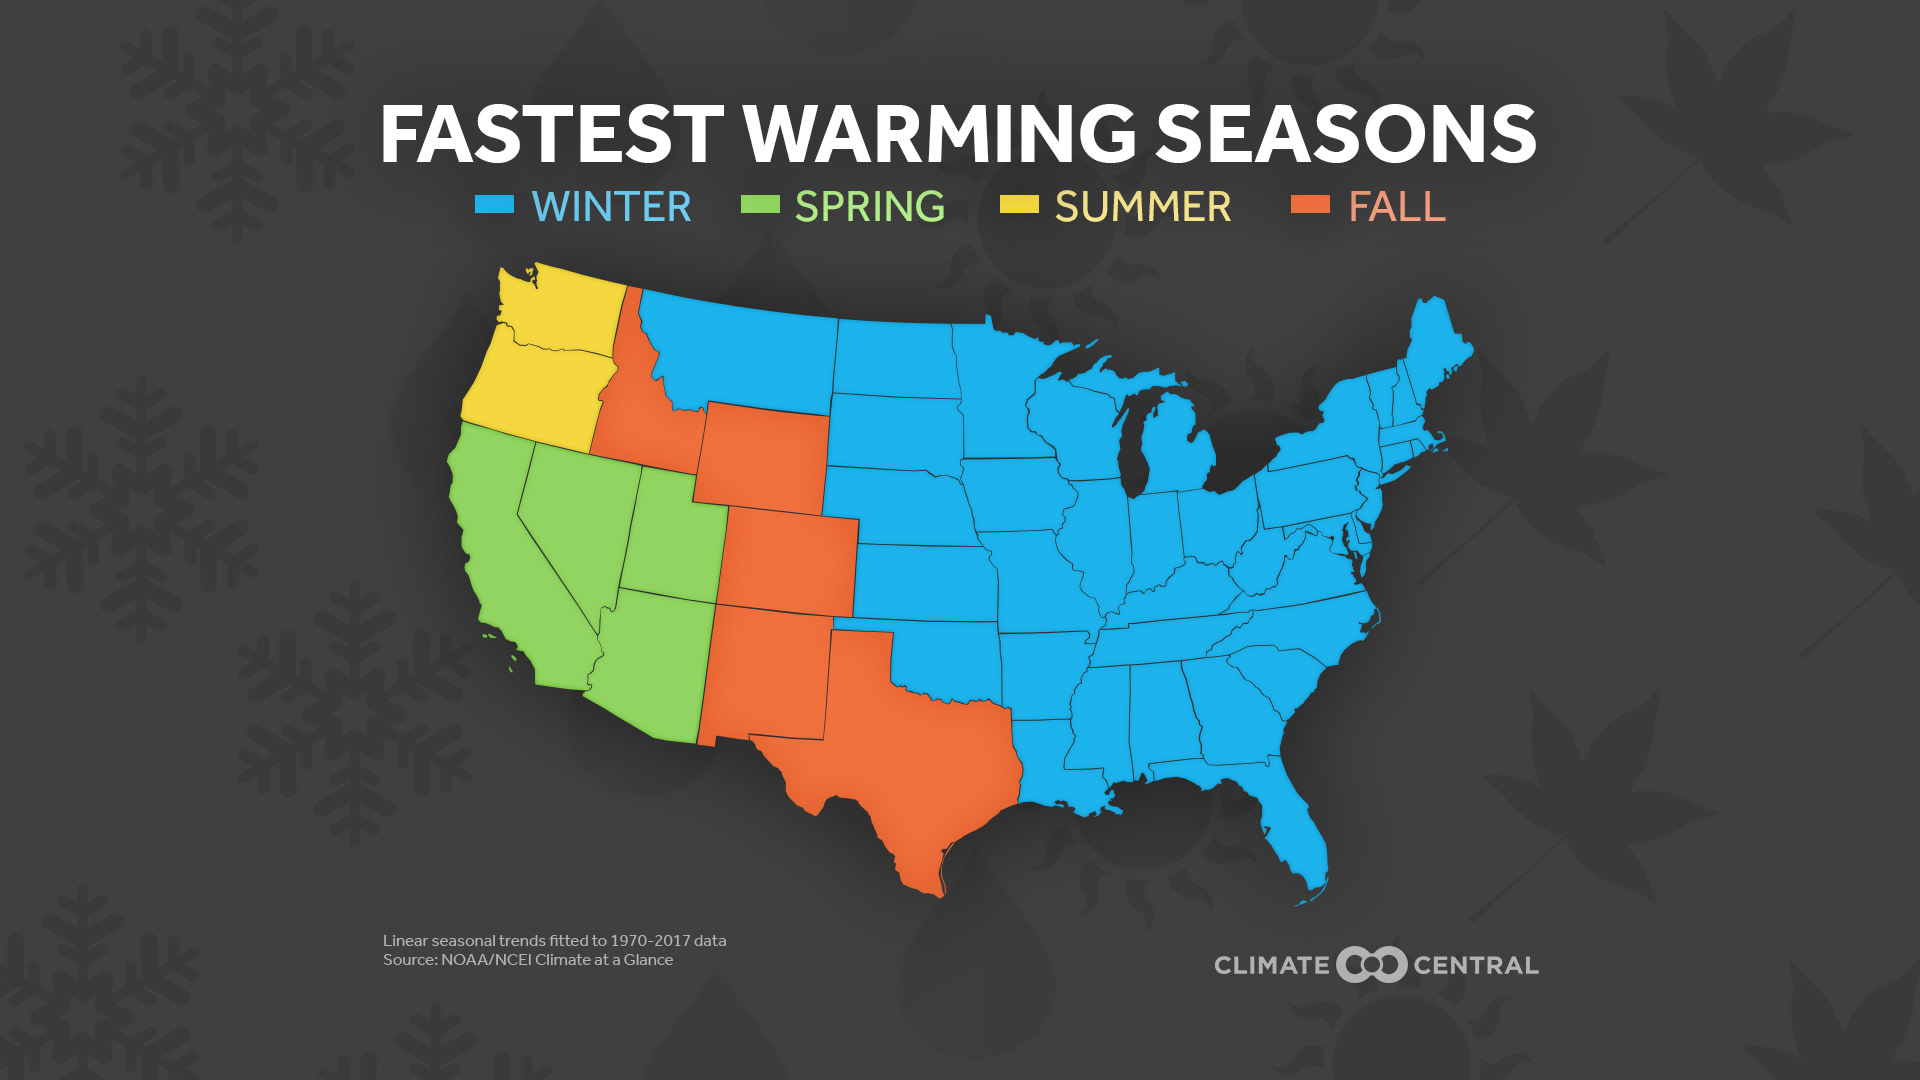
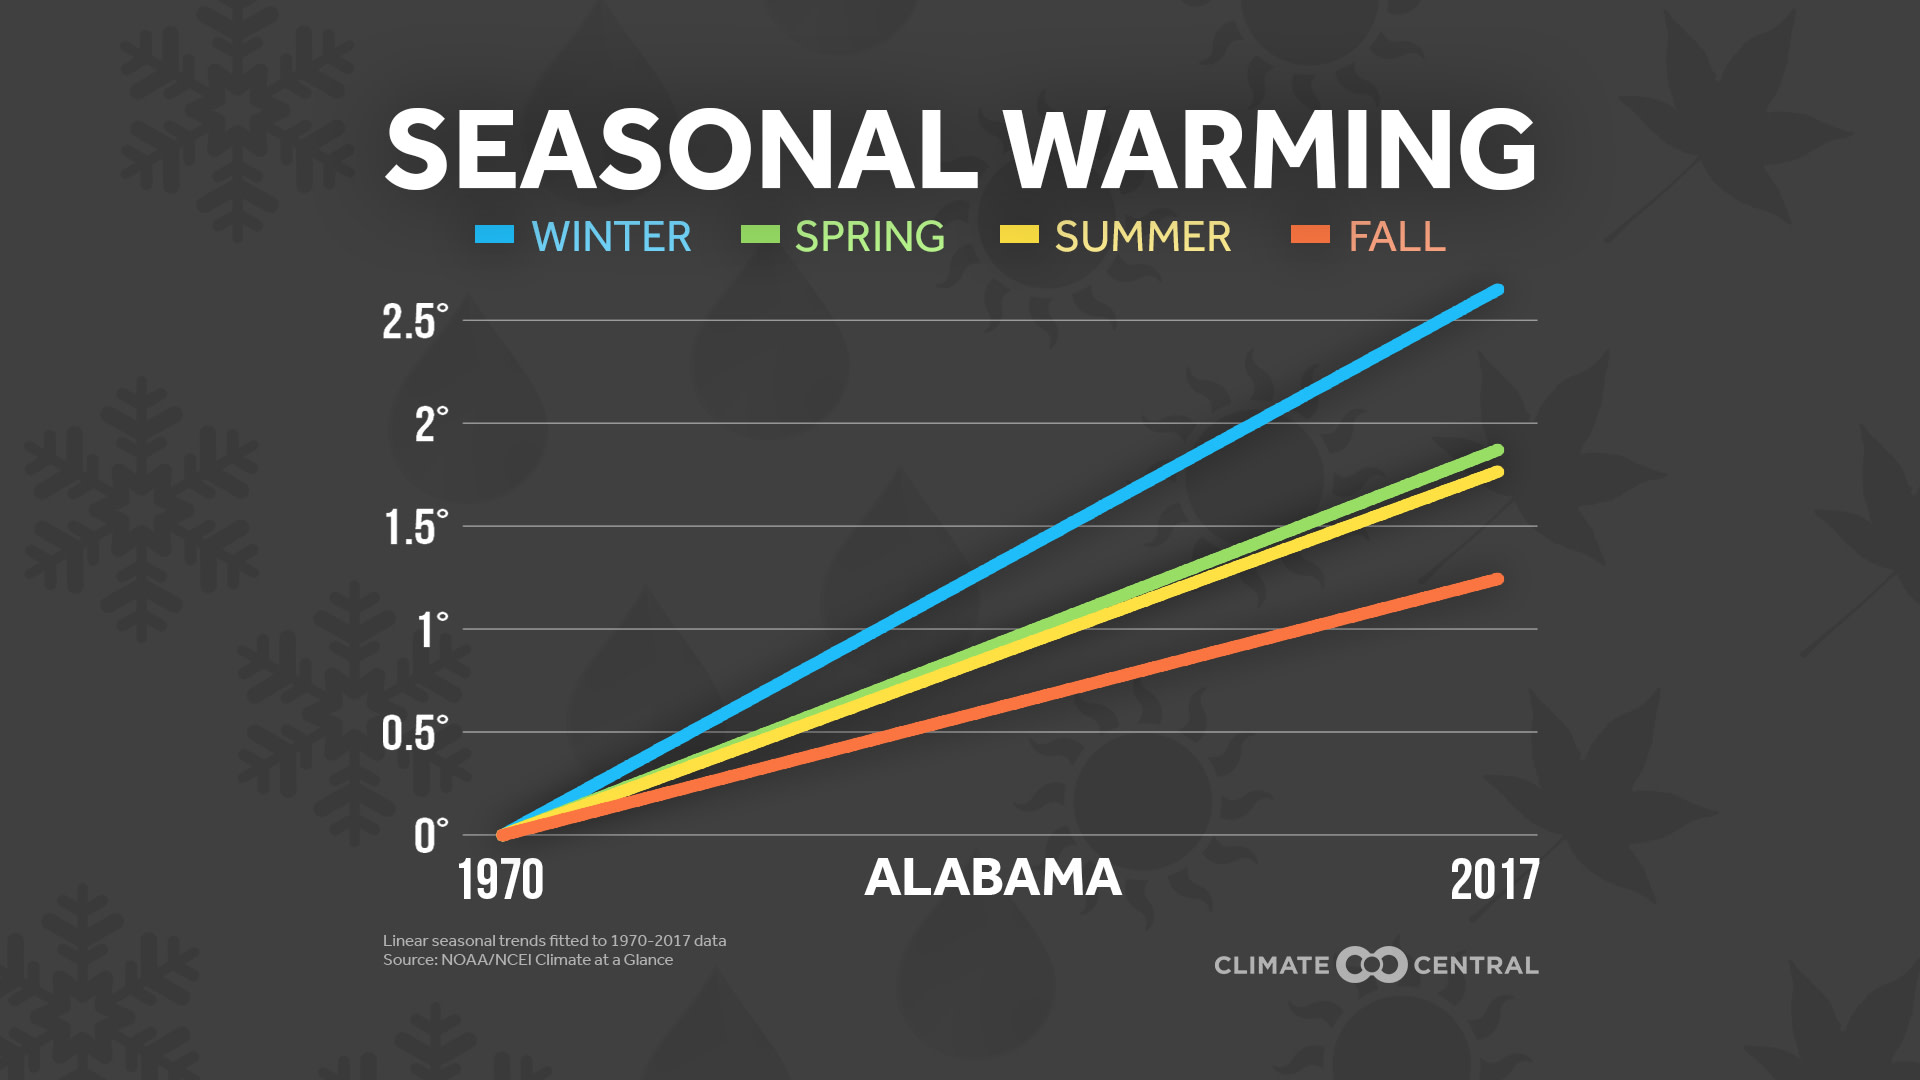
Climate change is causing temperatures to rise throughout the year, but some seasons are warming faster than others. As we approach the start of meteorological winter on December 1st, we see that winter is warming the fastest in most of the country.

Since 1970, winter has warmed at least 1°F in all states analyzed, and at least 3°F in two thirds of those states. Northern winters have heated up the most, with over 5°F of warming in Alaska, Minnesota, Vermont, and Wisconsin. Still, the warming trend is clear across all seasons. When measuring each season in each state, 93 percent of the seasons have warmed at least 1°F since 1970, while none have cooled 1°F.
In much of the West, the transitional seasons of spring and fall are warming the fastest. Warming springs in the Southwest are leading to longer allergy seasons and premature plant blooms, stressing agriculture by pushing plants out of sync with their pollinators. Meanwhile, faster fall warming near the Rockies can shorten the foliage season, increase home cooling costs, and allow disease-carrying insects to remain active. Summers are warming more quickly in Washington and Oregon, increasing the risk of wildfire damage and the resulting smoke pollution.
But winter is the fastest-warming season in 38 states, where the changing climate is harming local economies and ecosystems. Climate Central has shown that more winter precipitation is falling as rain, affecting western snowpack and nationwide winter sports industries. According to a report using 2015-2016 data, the winter sports of downhill skiing, snowboarding, and snowmobiling contributed over $20 billion to the U.S. economy. Low snow years saw an average loss of 17,400 jobs and over $1 billion. In less snowy places like the Southeast, fruit trees are suffering with less natural chilling time, hurting a multi-billion dollar industry. With warmer winters, even the apples from Thanksgiving pies may be threatened.
Methodology: Trends for meteorological seasons are calculated using monthly average temperature data between 1970 and 2017 (data from the NOAA NCEI). For clarity and the ability to compare different seasons, we have omitted the annual data points and displayed only the linear trends over time. Data for Hawaii and Puerto Rico are not available, so the cities of Honolulu, Hawaii and San Juan, Puerto Rico were substituted in those states’ graphics.